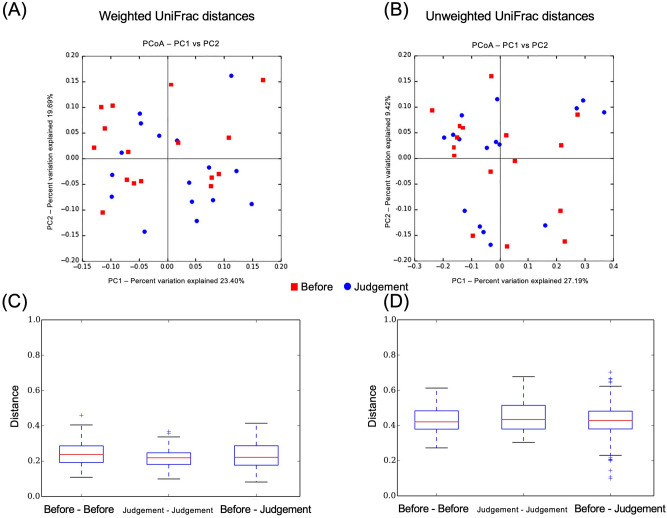
Figure 8.
Principal coordinates analysis revealed clustered communities of gut microbiota after eradication in the before and after eradication therapy groups. (A) Weighted UniFrac distances, (B) Unweighted UniFrac distances. Bar diagram showing the Mean UniFrac distances for Before–Before, Judgment–Judgment, and Before–Judgment participants. (C) Weighted UniFrac distances (Before–Before vs. Before–Judgment, P = 1.00; Judgment–Judgment vs. Before–Judgment, P = 1.00), (D) Unweighted UniFrac distances (Before–Before vs. Before–Judgment, P = 1.00; Judgment–Judgment vs. Before–Judgment, P = 0.87).

