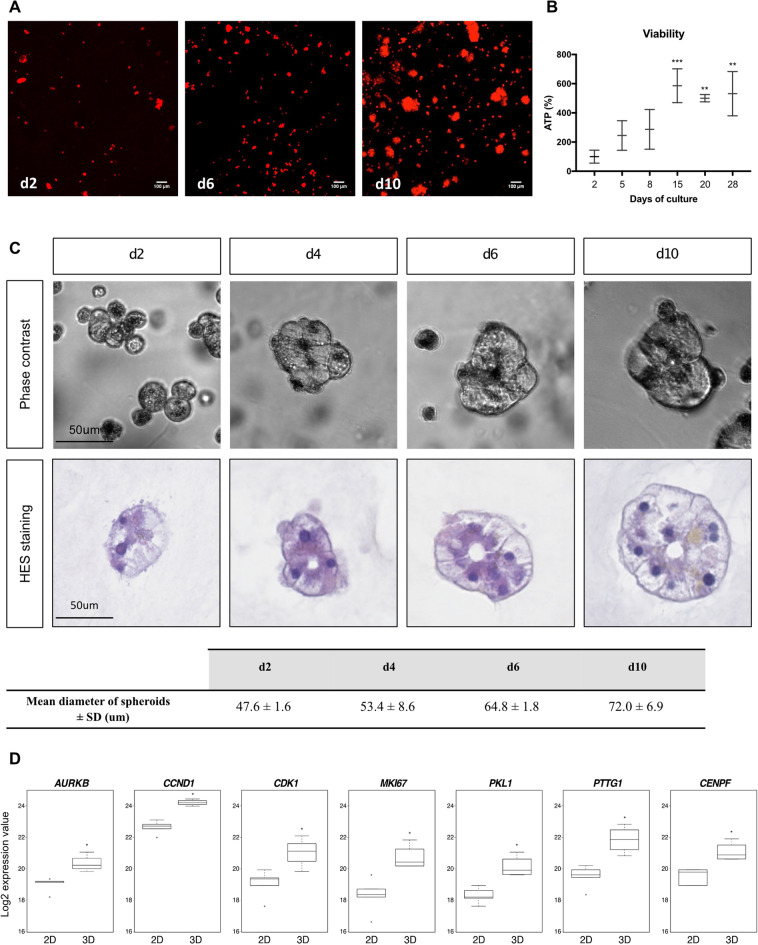
Figure 2.
The size of spheroids sharply increases and correlates with the expression of proliferation genes. (A) TPEF images of 3D cultured PHH at d2, d6 and d10 of culture (10× magnification, z projection). Scale bar = 100 μm. (B) The viability was assessed by measuring the cellular ATP content in 3D cultured PHH at different times of culture (n = 3) (Mean ± SD, **p < 0.01, ***p < 0.001, one-way ANOVA test). (C) Phase-contrast imaging and HES staining of spheroids at d2, d4, d6 and d10 of culture. Scale bar = 50 μm. Quantification of the mean diameter size of spheroids during the time of culture. Diameters of spheroids are from three independents experiments (Mean ± SD). (D) Boxplots extracted from transcriptomic analysis of the expression of the main genes involved in the proliferation of epithelial cells (AURKB, CCND1, CDK1, MIK67, PKL1, PTTG1, CENPF). (*p < 0.05, Mann–Whitney U test).

