Figure 3.
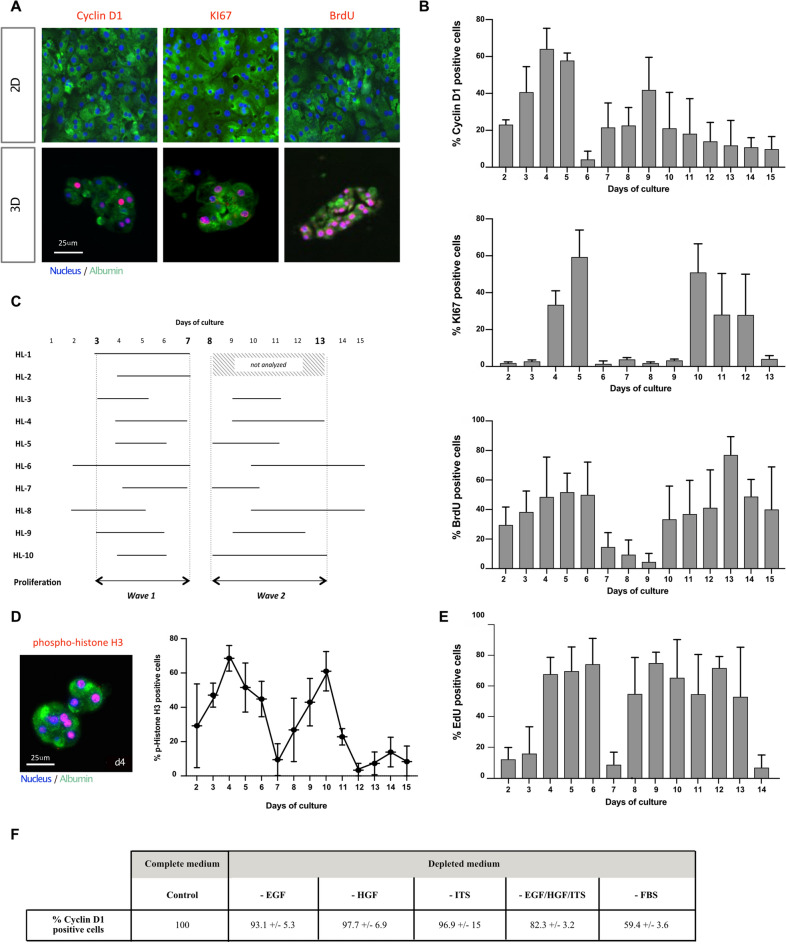
3D cultured PHH perform spontaneously two waves of proliferation. (A) Illustration of the staining of two markers of proliferation, Cyclin D1 and KI67, and the incorporation of BrdU (red) at d4 in the PHH cultured in 2D or in 3D. Albumin (green) was always stained in parallel to attest the hepatic phenotype. Nuclei (Dapi) were in blue. Scale bar = 25 μm. (B) Two waves of proliferation were observed in Hepoid during the first 2 weeks of culture as shown by the quantification of positive Cyclin D1 and KI67 cells and of the incorporation of BrdU. (C) These two waves of proliferation were observed in all cases of PHH analyzed (HL-3 to HL-10). The common proliferation waves always occurred between days 3 and 7 for the first wave and between days 8 and 13 for the second. For cases HL-1 and HL-2, quantification for the KI67 labeling index was done only during the 1st week. (D) (Left) Fluorescent immunostaining of phospho-histone H3 (red), a marker for mitotic cells, Albumin (green) and nuclei (blue) in Hepoid at d4 after 24 h of treatment with colcemid (1 μm). Scale bar = 25 μm. (Right) Mitotic index quantified by phospho-histone H3 positive cells in spheroids at the indicated time in the figure, after treatment with colcemid. (E) The incorporation of EdU was used to quantify the rate of proliferation of cryopreserved PHH cultured in 3D. (F) Percentage of proliferating PHH (Cyclin D1/Albumin positive cells) seeded in collagen gels at 1.5 mg/ml with complete culture medium (Control) or in medium depleted in EGF, HGF, ITS or FBS.

