Figure 4.
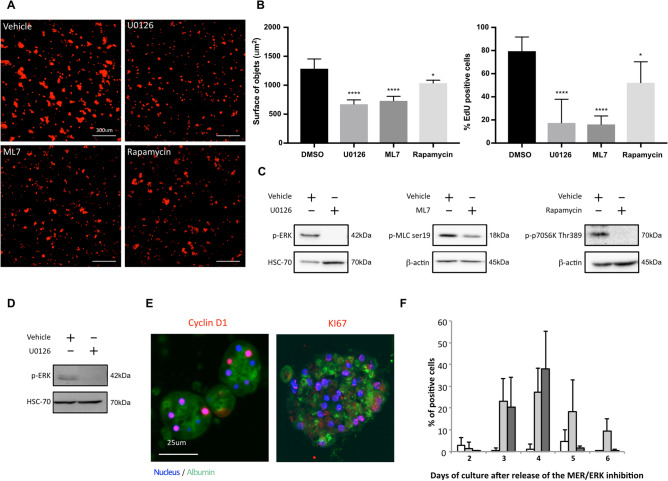
Implication of MEK1/2-ERK1/2 signaling pathway in the proliferation of Hepoid. Quantification of PHH proliferation after 6 days of culture in the presence of U0126 (20 μM), ML7 (20 μM), Rapamycin (10 nM) or vehicle (DMSO, 0.1%) (A–C). (A) TPEF images (left) and (right) quantification of the surface of Hepoid performed using ImageJ software. Scale bar = 300 μm. (B) Quantification of EdU incorporation during 24 h in the presence of inhibitors or vehicle. The results are expressed according to the DMSO-treated culture (*p < 0.05, **p < 0.01, ***p < 0.001, ****p < 0.0001, one-way ANOVA test). (C) Control of phospho-ERK, phospho-MLC on Serine 19 and phospho-P70 on Threonine 389 inhibition in the presence of U0126, ML7 and Rapamycin, respectively (+), or vehicle (−). Transient inhibition of the MEK1/2-ERK1/2 pathway was performed during 48 h by U0126 (20 μM) in 3D cultured PHH after the two waves of proliferation (D–F). (D) Phospho-ERK inhibition in the presence of U0126 (+) or vehicle control (−). Controls were done in presence of 0.1% DMSO. (E) Cyclin D1 or KI67 (red), Albumin (green) and nuclei (blue) staining. Scale bar = 25 μm. (F) Quantification of Cyclin D1 (light grey) and KI67 (dark grey) positive cells after release of the inhibition. Cyclin D1 was quantified in cells treated vehicle (white). No KI67 positive cell has been detected after treatment with the vehicle.

