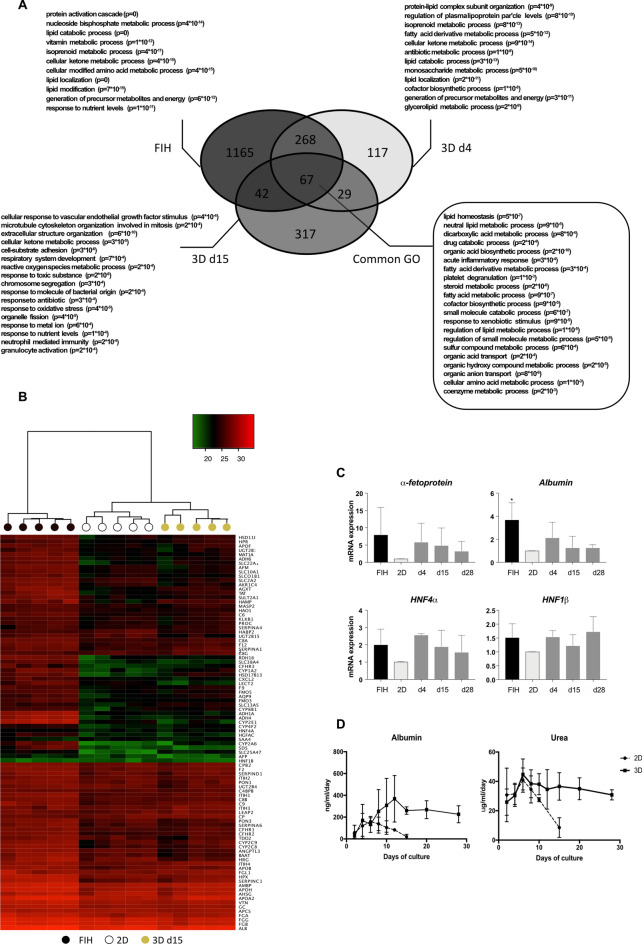
Figure 5.
Transcriptomic analysis reveals great similarities between FIH and 3D cultured PHH. (A) Transcriptomic analysis of up-regulated genes in FIH and 3D cultured PHH cultured during 4 (d4) and 15 (d15) days. The numbers indicate the numbers of differentially up-regulated genes compared to 2D culture with fold change > 2 and p < 0.05 using WebGestalT. In bold, the most enriched Go Terms found in Webgestald online tool, an important part of them being shared between the three conditions (Common GO). Indicated p-values are after Benjamini–Hochberg multiple testing correction. (B) Heatmap showing levels of major hepatic genes (LiGEP) in FIH (black), at maximum differentiation in 2D culture at d4 (white) and in 3D cultured PHH at d15 (yellow). (C) Quantification of the gene expression patterns by RT-qPCR of α-fetoprotein, albumin, HNF4α and HNF1β in FIH (black), 2D cultures (light grey) and 3D cultured PHH (dark grey), 4 (d4), 15 (d15) and 28 days (d28) after seeding. The results are from at least three independant experiments and are expressed according to the 2D culture level (Mean ± SD, *p < 0.05, one-way ANOVA test). (D) Albumin and urea secretions in PHH cultured in 2D or in 3D at the indicated times of culture. The results are from at least three independant experiments (Mean ± SD).

