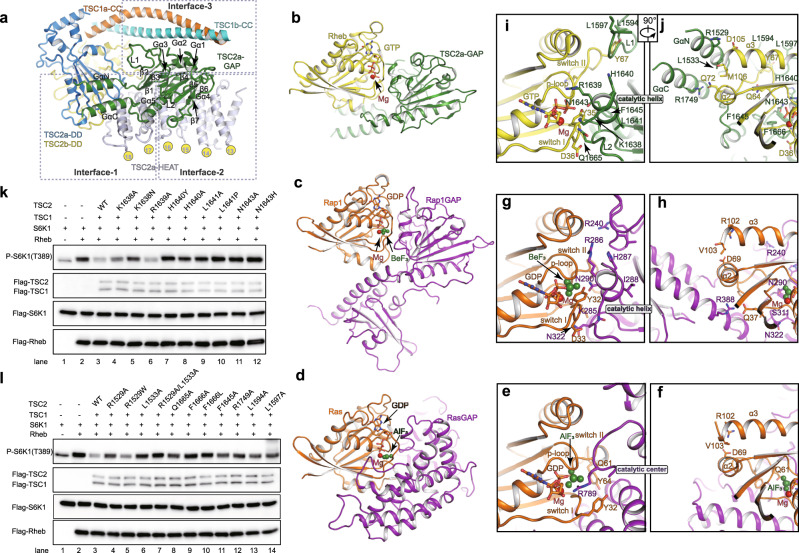
Fig. 3. TSC2 GAP catalytic mechanism and putative GAP–Rheb binding.
a Close-up view of TSC2a GAP domain and its positioning. Three inter-domain contacts are highlighted with dashed boxes. Structural comparison of Rheb–TSC2 GAP (b), Rap1–Rap1GAP (PDB:3BRW) (c), and Ras–RasGAP (PDB:1WQ1) (d). The structures are shown in a similar view. TSC2 GAP and Rheb are shown in green and yellow, respectively. Rap1 and Ras are colored in orange and Rap1GAP and RasGAP are colored in magenta, respectively. In (b), the GTP-bound Rheb (PDB:1XTS) and TSC2 GAP domain were, respectively, superimposed to Rap1 and Rap1GAP in Rap1–Rap1GAP structure. Two different close-up views of the catalytic centers of RasGAP (e, f), Rap1GAP (g, h), and TSC2 (i, j). The structures are derived from (b–d). Magnesium cations are shown as red balls. The beryllium trifluoride (BeF3) and aluminum trifluoride (AlF3) are shown as green balls. The GDP–BeF3 and GDP–AlF3 are the mimetic ATP in ground and transition states, respectively. Residues involved in binding and catalysis are shown in sticks. k, l Cell-base GAP activity assays of wild-type TSC2 and TSC2 mutants. The HEK293A cells were transfected with (+) or without (−) the indicated plasmids in the upper of the panel. The activities were detected by western blotting with antibody against phosphorylated-S6K (T389). The effects of residues involved in catalysis (k) and Rheb binding (l) were tested. Source data are provided as a Source Data file for uncropped blots.

