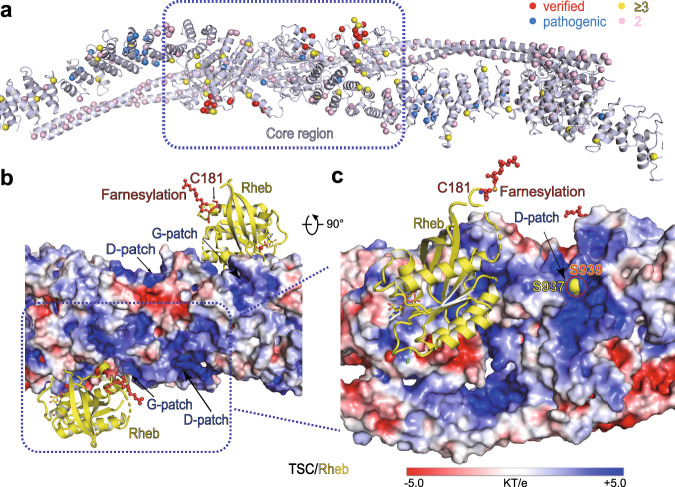
Fig. 4. TSC complex surface feature and functional implications.
a The cartoon structure of TSC complex are shown with cancer-associated mutations highlighted with colored balls. The information of patient-derived mutations was obtained from the Catalogue of Somatic Mutations in Cancer (COSMIC)33. Critical residues for GAP activity that were verified in our study are shown as red balls, pathogenic mutations are shown as blue balls, and the mutations identified in patients ≥3 and 2 times in COSMIC database are shown as yellow and pink balls, respectively. b, c Electrostatic potential surface of TSC complex is shown in two views. Two putative Rheb molecules (yellow) are shown in cartoon with farnesylation at C181 (red) indicated (b). The traced residue S937 is shown in yellow balls. The positively charged patches around dimerization domain (D-patch) and GAP domain (G-patch) are shown in a close-up view.

