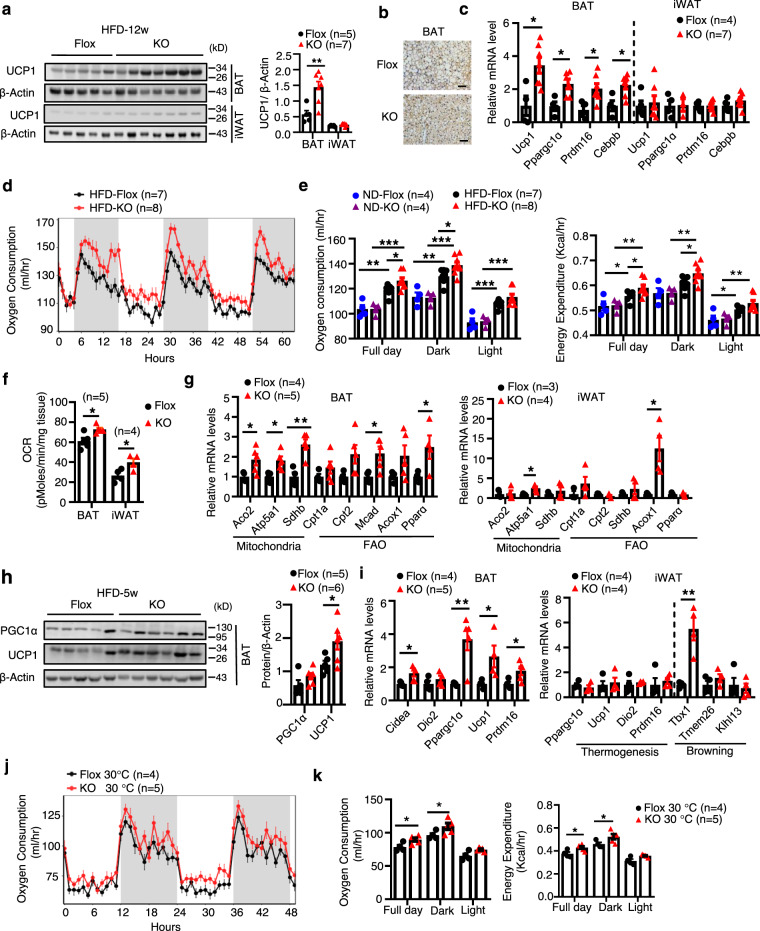
Fig. 4. T cell-specific knockout of DsbA-L increases energy expenditure and BAT thermogenic function.
a UCP1 expression in BAT and iWAT of DsbA-LCD4-KO mice (n = 7) and control littermates (n = 5) fed an HFD for 12 weeks. b Immunohistochemical staining of UCP1 in BAT of DsbA-LCD4-KO mice and control littermates fed an HFD for 12 weeks. Scale bars: 50 μm. c Thermogenic gene expression in BAT and iWAT of DsbA-LCD4-KO mice (n = 7) and control littermates (n = 4) fed an HFD for 12 weeks. d The oxygen consumption of DsbA-LCD4-KO mice (n = 8) and control littermates (n = 7) fed an HFD for 5 weeks was measured. e The average of oxygen consumption and energy expenditure between DsbA-LCD4-KO mice and control littermates fed an ND (n = 4/group) or HFD (n = 7–8/group) for 5 weeks. f The basal OCR of BAT (n = 5/group) and iWAT (n = 4/group) collected from DsbA-LCD4-KO mice and control littermates fed an HFD for 5 weeks. g mRNA levels of genes involved in mitochondrial and fatty acid metabolism in the BAT (n = 4–5/group) and iWAT (n = 3–4/group) of DsbA-LCD4-KO mice and control littermates fed an HFD for 5 weeks. h Western blot analyses of UCP1 and PGC1α in the BAT collected from DsbA-LCD4-KO mice (n = 6) and control littermates (n = 5) fed an HFD for 5 weeks. i mRNA levels of genes involved in thermogenesis in the BAT (n = 4–5/group) and iWAT (n = 4/group) of DsbA-LCD4-KO mice and control littermates fed an HFD for 5 weeks. j The oxygen consumption of DsbA-LCD4-KO mice (n = 5) and control littermates (n = 4), which were fed an HFD for 5 weeks and then tested under thermoneutral conditions (30 °C). k The average of oxygen consumption and energy expenditure between DsbA-LCD4-KO mice (n = 5) and control littermates (n = 4) which were fed an HFD for 5 weeks and then tested under thermoneutral conditions (30 °C). Data shown are representative of three independent experiments. All data are presented as mean ± SEM. Statistical values p < 0.05 (*), p < 0.01 (**), p < 0.001 (***) are determined by two-tailed unpaired Student’s t-test (a (right panel), c, f, g, h (right panel), i or ANCOVA test (e, k)). Source data are provided as a Source Data File.

