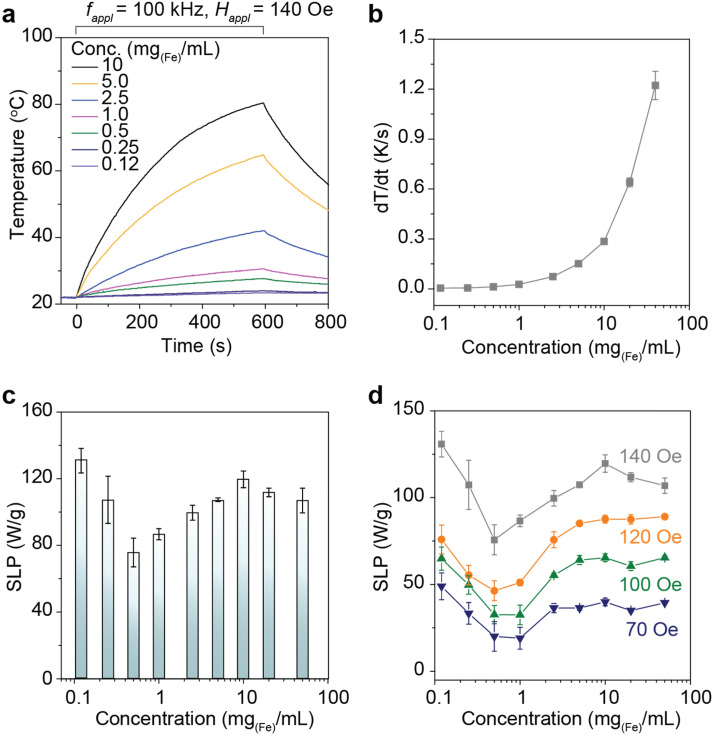
Figure 2.
Concentration-dependent AC magnetic heat induction characteristics of Mg–γFe2O3 nanofluids. (a) AC heat induction curves of Mgx–γFe2O3 nanofluids with different concentrations (0.12 ~ 10 mg(Fe)/mL) measured at HAC,appl of fappl = 100 kHz and Happl = 140 Oe. (b,c) Concentration-dependent dT/dt (heating up rate) (b) and SLP changes (c). (d) Concentration-dependent SLP changes measured at the different strength of HAC,appl of 70 (blue), 100 (green), 120 (orange), and 140 Oe (gray).

