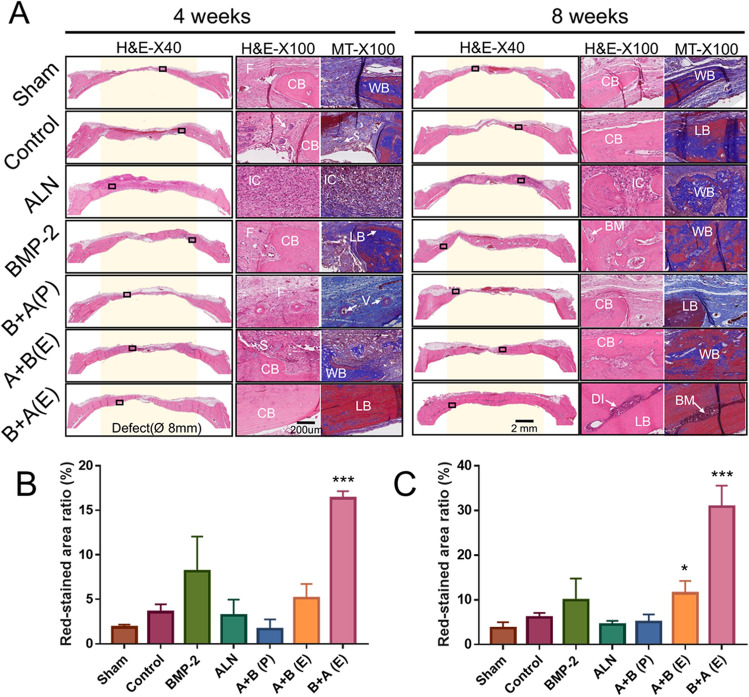
Figure 7.
Histological evaluation of bone regeneration in rat calvarial defects at 4 and 8 weeks postoperatively: (A) Image for hematoxylin and eosin staining and Masson’s trichrome staining. Yellow background shows where defects were created. Semi-quantitative analysis of red-stained area ratio (%) of Masson’s trichrome staining in (B) 4 weeks and (C) 8 weeks using ImageJ software (V1.8.0_172, NIH, USA) (https://imagej.nih.gov/ij/). CB, cortical bone; LB, lamellar bone; WB, woven bone; F, fibrous tissue; IC, inflammation cell; S, scaffold; BM, bone marrow; DI, diploe; V: vessels. (×40 and ×100 magnification, scale bar = 200 μm. *p < 0.05; ***p < 0.001 versus control group; Two-way krANOVA test).

