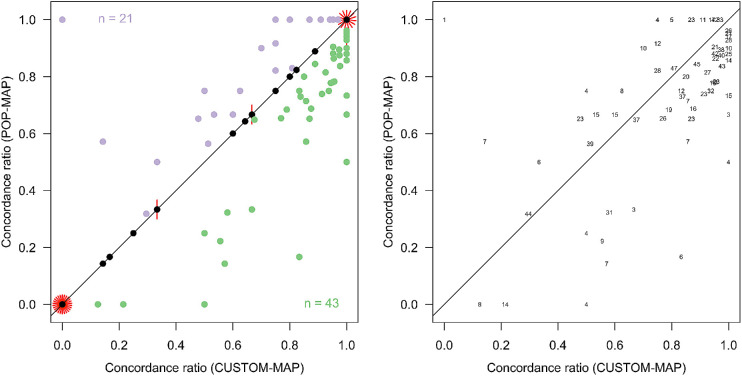
Figure 5.
Difference in concordance ratio when using CUSTOM-MAP vs POP-MAP for each eye. The left panel shows one dot per eye, with red stalks showing a count of eyes that share ratios (a Sunflower plot). Purple dots indicate those eyes where POP-MAP has a higher ratio (21 eyes), and green the converse (43 eyes). The right panel shows the same data, but each symbol gives the number of damaged visual field locations (total deviation < −5 dB) for those eyes where the concordance ratio differed.

