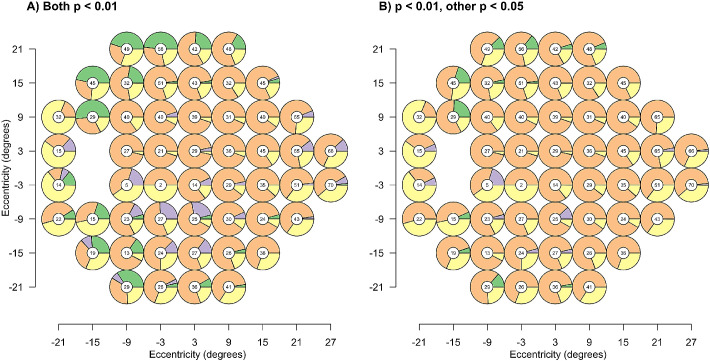
Figure 6.
Each pie shows the proportion of eyes that have concordance at each location for: CUSTOM-MAP only (green); POP-MAP only (purple); both CUSTOM-MAP and POP-MAP (orange); and neither maps (yellow). The number in the middle of each location is the number of eyes with total deviation < −5 dB at that location. (A) The situation where agreement between the two mapping schema requires both to match to an area of cpRNFL thickness <1% of normal. (B) The situation where agreement is relaxed such that one map must be cpRNFL thickness <1% of normal with the other being cpRNFL thickness <5% of normal.

