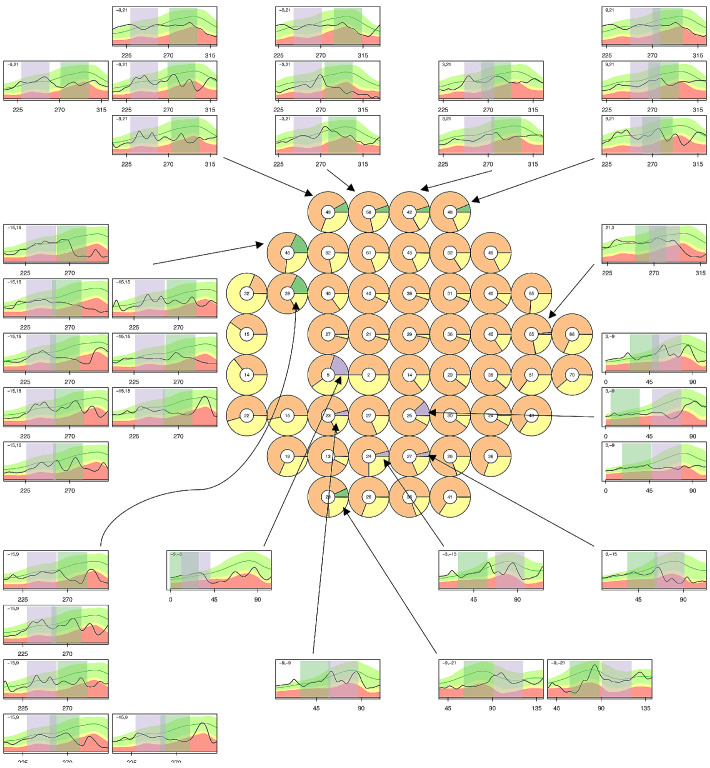
Figure 8.
The central 24-2 graphic is as in Figure 6, with the segments of OCT plots around the edge given for each case where one mapping schema appeared to “win.” Green shading in the central plot indicates the number of eyes for which the corresponding location maps to a cpRNFL thickness < 1% for CUSTOM-MAP and cpRNFL thickness> 10% for POP-MAP; purple shading shows the reverse; yellow indicates the number of eyes where neither map has cpRNFL thickness< 1%, and orange shows the remaining eyes. The number in the middle of each location is the total number of eyes with total deviation < −5 dB at that location. For the surrounding OCT plots, green vertical shading shows the area indicated by CUSTOM-MAP, and purple POP-MAP.

