Figure 1.
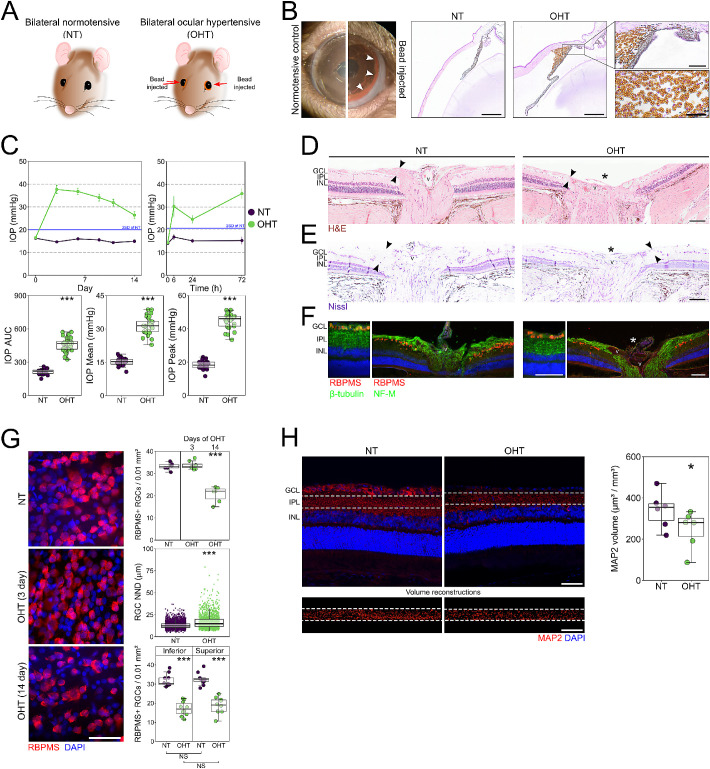
Induction of OHT via paramagnetic bead induction. (A) Brown Norway rats underwent intracameral injections of paramagnetic beads bilaterally. Naïve, un-operated animals served as controls. (B) Beads were directed into the drainage structures of the eye via a rare-earth magnet (5-mm tip) (left panel). Histology (right panels and insets) demonstrated that beads remained within the drainage structures of the trabecular meshwork and Schlemm's canal. This resulted in a significant and robust IOP increase, peaking at 72 hours post-induction and sustaining until euthanasia. Scale bars: 500 µm (right panels); 100 µm (right inset, upper); 50 µm (right inset, lower). (C) Following 14 days of OHT, changes to the RGC layer and nerve fiber layer thinning (black arrows at the optic nerve head) were apparent, with qualitatively observed optic nerve excavation (asterisk; n = 13 rats and 26 eyes for NT; n = 15 rats and 30 eyes for OHT). Inner retinal morphology is shown through two modalities: H&E staining (D) and Nissl staining (E). Arrows denote the nerve fiber layer, and v denotes the central retinal vessel. Scale bar: 100 µm. (F) Immunofluorescence for antibodies against RGC specific markers (RBPMS, β-tubulin, NF-M). Scale bar: 100 µm. (G) RGC populations were assessed in flat-mount retinas confirming no early change in RGC density (3 days after OHT induction) and a significant loss of RGCs and increased NND of RGCs following 14 days of OHT (n = 6 NT; n = 6 OHT at 14 days; n = 8 OHT at 3 days). There was no detectable region-specific loss between superior and inferior retina (n = 10 NT eyes; n = 10 OHT eyes from a separate cohort of animals). Scale bar: 20 µm. (H) OHT also resulted in significant dendritic atrophy (MAP2 labeling) as assessed by MAP2 volume reconstructions in the IPL (cropped area in white and corresponding reconstruction below; n = 6 eyes for NT; n = 6 eyes for OHT), which is suggestive of dendritic atrophy and retraction. Scale bar: 50 µm. *P < 0.05, **P < 0.01, ***P < 0.001; NS, non-significant (P > 0.05). NND, nearest neighbor distance; IPL, inner plexiform layer.

