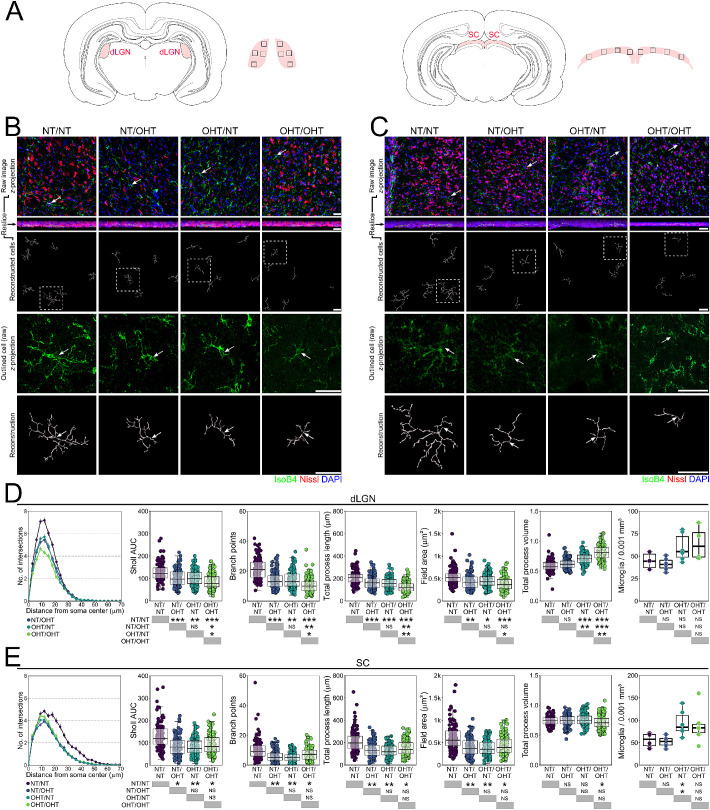
Figure 9.
Microglia activation persists into terminal visual thalami following OHT. (A) Microglia were assessed from dLGN and SC sections (SC, n = 103 NT/NT, 114 NT/OHT, 115 OHT/NT, 121 OHT/OHT; dLGN, n = 123 NT/NT, 116 NT/OHT, 138 OHT/NT, 130 OHT/OHT; from n = 3 brains [6 independent hemispheres] for each condition). Regions of images are shown by black inset boxes in the schematics. Morphologies of individual microglia from the dLGN (B) and SC (C) were assessed by high-resolution confocal imaging and Imaris reconstructions (labels to left of image panel). (D, E) Multiple metrics of microglia morphology demonstrated significant changes in microglia morphology between NT/NT and all other groups (D shows dLGN, E shows SC). These results were more binary (i.e., damage to a single retina drives neuroinflammatory insults to both terminating hemispheres), suggesting that neuroinflammatory signatures propagate even when only a small percentage of axons are damaged or dystrophic. For complete n please see Methods. White arrows denote microglia soma position in B and C, scale bars = 30 µm in B and C, *P < 0.05, **P < 0.01, ***P < 0.001. NS, not significant (P > 0.05).

