
Figure 5.
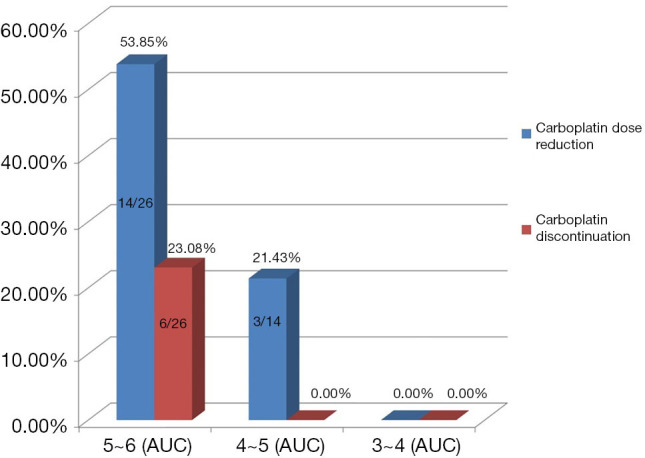
Comparison of dose reduction and discontinuation rates at different initial doses of carboplatin in the TCbHP group. AUC, area under the concentration-time curve.
Official websites use .gov
A
.gov website belongs to an official
government organization in the United States.
Secure .gov websites use HTTPS
A lock (
) or https:// means you've safely
connected to the .gov website. Share sensitive
information only on official, secure websites.
Comparison of dose reduction and discontinuation rates at different initial doses of carboplatin in the TCbHP group. AUC, area under the concentration-time curve.