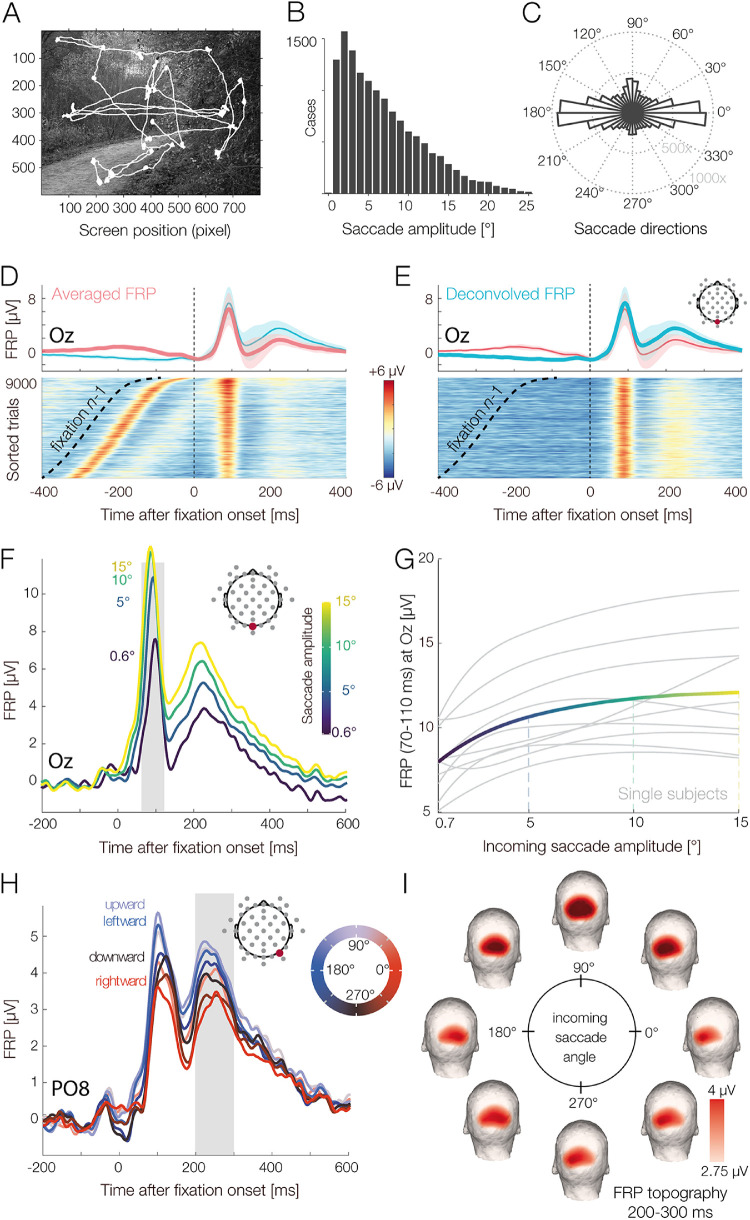
Figure 7.
Visual search experiment with natural scenes. (A) Example scene with overlaid gaze path. (B) Distribution of saccade amplitudes and (C) saccade directions in the task. (D) FRP waveform over visual cortex without deconvolution (simple average, red line) and with deconvolution (blue line). Color-coded single-trial EEG of all participants (erpimage), sorted by the onset latency of the preceding (n – 1) fixation on the scene. (E) Same FRP data as in panel D. The erpimage shows the estimated deconvolved response plus the residuals—that is, the EEG activity not explained by the model. The overlapping activity from fixation n – 1 was successfully removed. (F) Effect of saccade amplitude on the FRP, as revealed by the deconvolution model. Saccade amplitude modulates the entire postsaccadic waveform, with EEG amplitude changing as a nonlinear function of saccade size for the P1 (lambda response) and as a more linear function for the N1 component. (G) When saccade size is plotted against P1 amplitude (within the gray-shaded interval in panel F), the nonlinear, logarithmic relationship becomes obvious. The solid line depicts the mean over participants; gray lines depict single-subject estimates. (H) The FRP is also affected by the direction of the preceding saccade, with upward saccades generating the strongest brain responses. This effect is again nonlinear and was therefore modeled by a set of circular spline functions coding the saccade angle. (I) Scalp topographies of the saccade direction effect at the latency of the second positive deflection (P2, 200–300 ms; see gray shading in panel H). A topographic lateralization for leftward versus rightward saccades and a differentiation between upward versus downward saccades can be seen.

