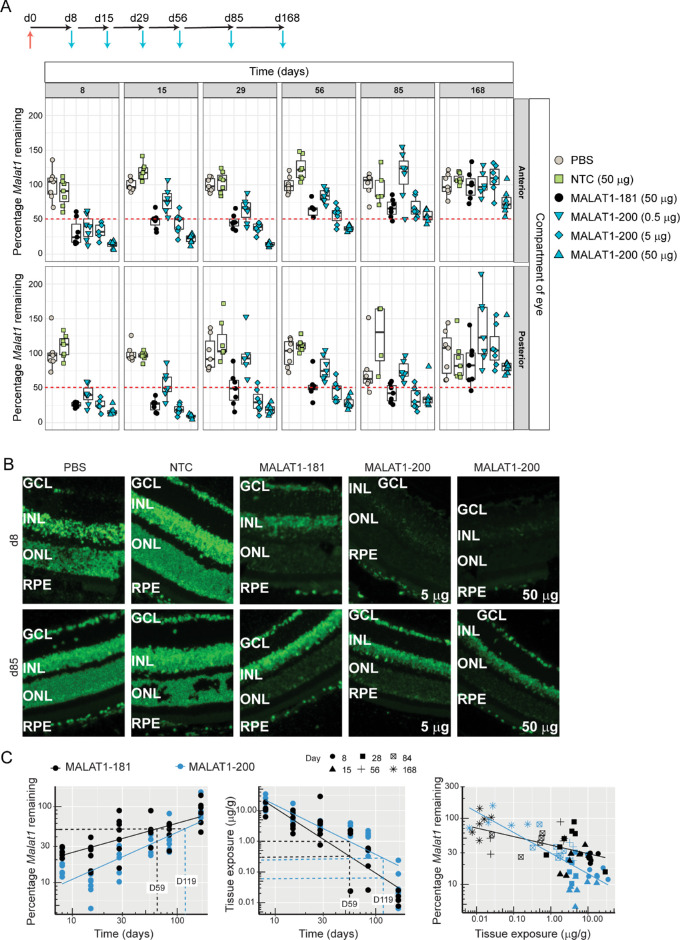
Figure 3.
Stereopure oligonucleotide (MALAT1-200) leads to more durable Malat1 knockdown in the mouse eye than a stereorandom control. (A) Schematic representation of dosing regimen for longer-term mouse study. Mice were dosed on day 0 (d0, red arrow) and were evaluated on days 8 (d8, 1 week), 15 (d15, 2 weeks), 29 (d29, 1 month), 56 (d56, 2 months), 85 (Dd85, 3 months), and 168 (d168, 6 months, blue arrows). The percentage of remaining Malat1 RNA after treatment at days 8, 15, 29, 56, 85, and 168 post-IVT injection (time points indicated across top of graph). From left to right within each time point, data for treatment with PBS (beige), 50 µg NTC (green), 50 µg stereorandom MALAT1-181 (black), or stereopure MALAT1-200 at 0.5 µg (blue inverted triangle), 5 µg (blue diamond), and 50 µg (blue triangle) are shown (n = 7). Each point represents one treated eye. (B) Visualization of Malat1 RNA expression (green) after treatment with PBS, NTC, 50 µg stereorandom oligonucleotide (MALAT1-181), or stereopure oligonucleotide (MALAT1-200, 5 µg or 50 µg) at days 8 and 85 in mouse retina. Treatment is indicated across the top of the images; the time points are indicated to the left. (C) Efficacy comparisons between 50 µg stereopure (MALAT1-200) and stereorandom (MALAT1-181) oligonucleotides in posterior portion of eye. Left: the percentage Malat1 remaining over time. Days 59 (black) and 119 (blue), when MALAT1-181- or MALAT1-200-treated samples return to 50% expression, respectively, are indicated by dotted lines. Center: oligonucleotide tissue exposure over time, with days 59 and 119 indicated by dotted lines. Right: the percentage of Malat1 remaining with respect to oligonucleotide tissue exposure. Data for stereorandom (black) and stereopure (blue) oligonucleotides are shown for all time points.

