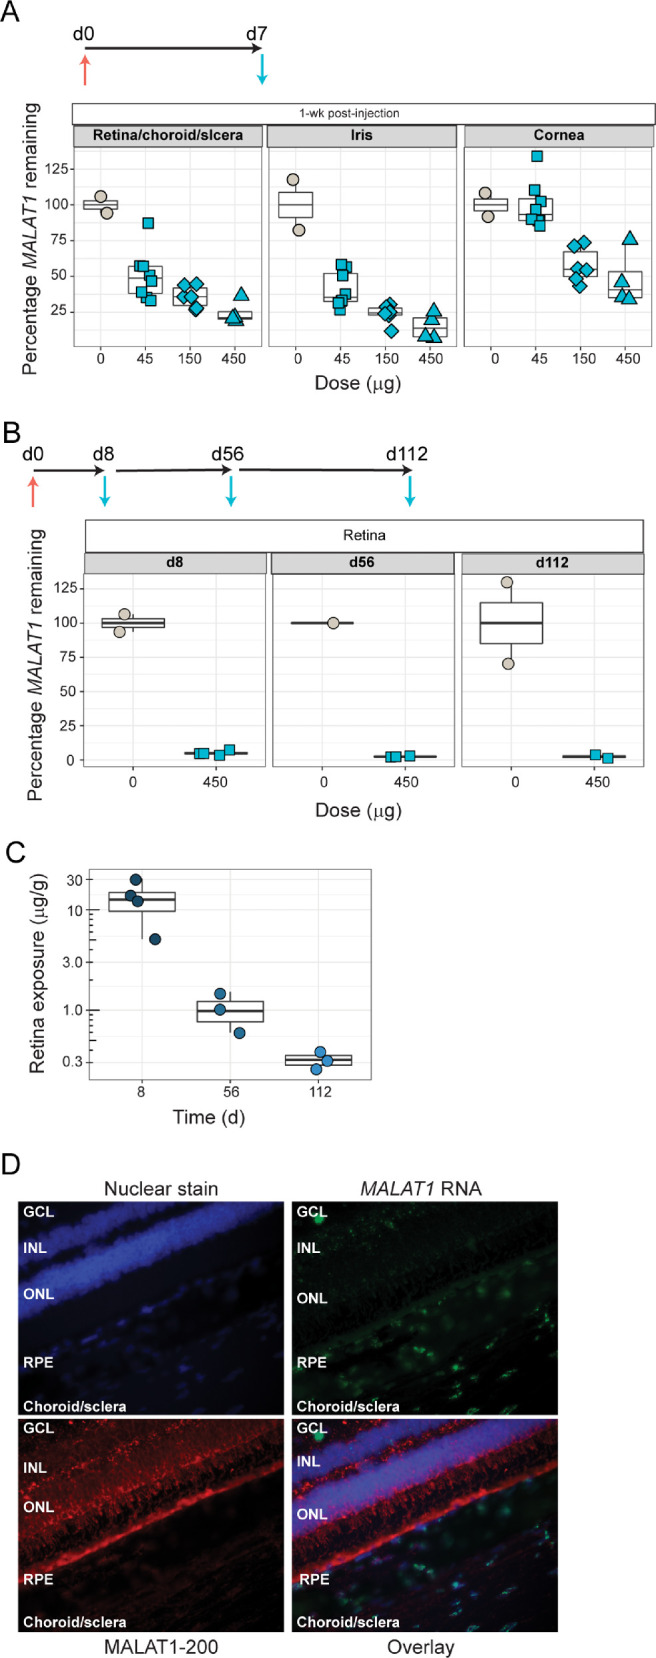
Figure 4.

Stereopure oligonucleotide (MALAT1-200) leads to durable knockdown of MALAT1 in NHP retina. (A) Schematic representation of 1-week experiment in NHP; animals were dosed (red arrow) with a single IVT injection on day 0 (d0) and samples were evaluated on day 7 (d7, blue arrow). Percentage MALAT1 RNA expression at 1 week after treatment with PBS (beige, 0 µg) or 45 µg (blue squares), 150 µg (blue diamonds), or 450 µg (blue triangle, dose indicated at the bottom of graph) stereopure oligonucleotide in retina/sclera/choroid, iris, or cornea (tissue indicated at the top of graph). PBS: n = 1 treated eye with technical replicates. Oligonucleotide: 45 µg, n = 4 treated eyes with technical replicates for each eye; 150 µg, n = 3 treated eyes with technical replicates for each eye; 450 µg, n = 2 treated eyes with technical replicates for each eye. (B) Schematic representation of longer-term study in NHPs; animals were dosed (red arrow) with a single 450-µg IVT injection on day 0 (d0), and samples were evaluated on days 8 (d8, 1 week later, blue arrows), 56 (d56, 2 months later), and 112 (d112, 4 months later). MALAT1 expression at d8, d56, and d112 after treatment with PBS (beige, 0 µg) or stereopure oligonucleotide (blue, MALAT1-200) in NHP retina. PBS: n = 1 treated eye with technical replicates. Oligonucleotide: 450 µg, n = 2 treated eyes with technical replicates for each eye at 1 week and 2 months; n = 1 eye with technical replicates at 4 months. (C) From the same longer-term experiment depicted in panel B, MALAT1-200 was quantified in the retina (retina exposure) at days 8, 56, and 112. (D) Visualization of MALAT1 RNA (green) and MALAT1-200 (red) at d112 (4 months) in NHP retina after injection of 450 µg stereopure oligonucleotide (as shown in panel B). Nuclear DNA (blue) visualized by Hoechst staining.
