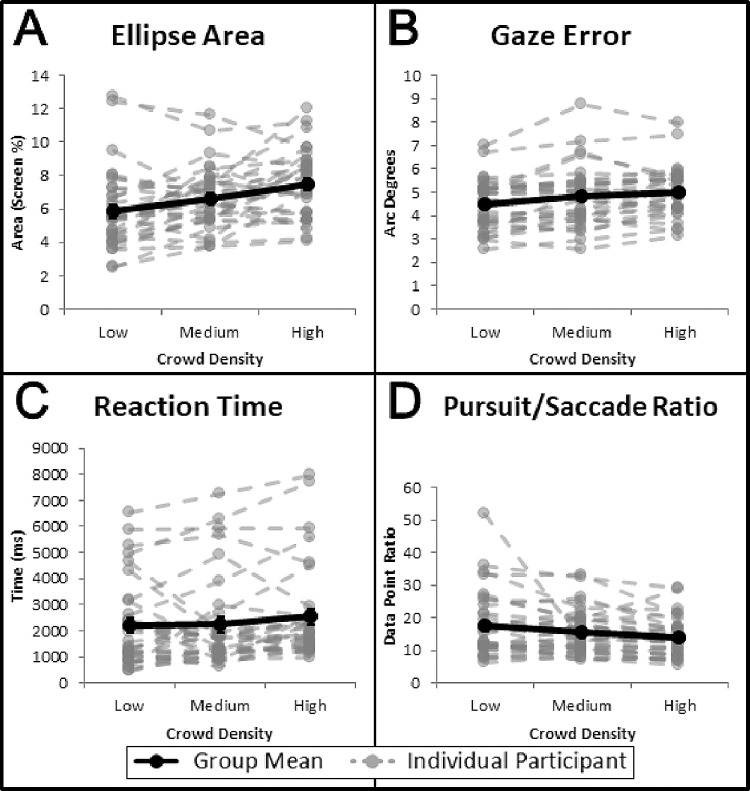
Figure 4.
Group mean (black solid lines) and individual mean (gray dashed lines) data are shown for the four performance outcomes of interest and across the three levels of crowd density. (A) Ellipse area, (B) gaze error, (C) reaction time, and (D) pursuit/saccade ratio. Standard errors are shown for the group means (some not visible).

