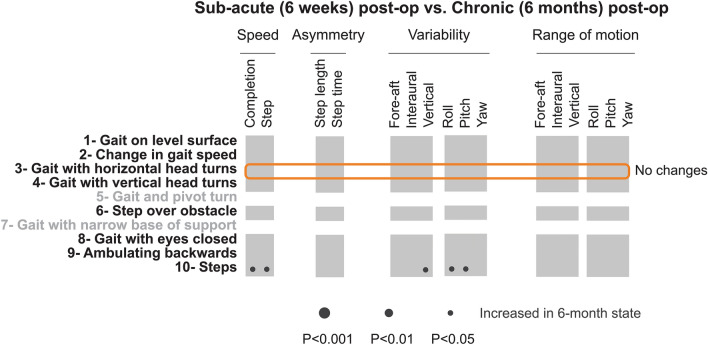
Figure 5.
Comparison of objective head movement kinematics of sub-acute and chronic post-op patients. Each column corresponds to a kinematic measure, while rows indicated FGA tasks. Dark circles show increased measure > 6 months after the surgery. The radius of the circle indicates the level of significance of the difference between the two groups. Orange box indicates the FGA task in which patients altered their kinematics the most from pre-op and sub-acute post-op patients.

