FIGURE 3.

Interregional fluorodeoxyglucose connectivity matrices across the sibling control and Down syndrome groups. The plots display the number of interregional connections across all individuals in each group

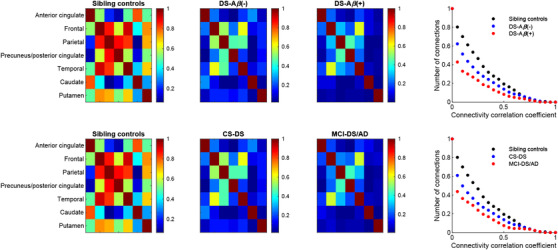
Interregional fluorodeoxyglucose connectivity matrices across the sibling control and Down syndrome groups. The plots display the number of interregional connections across all individuals in each group