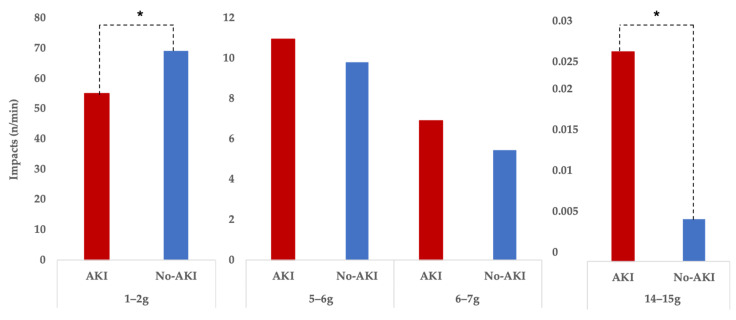
Figure 4.
Differences between runners showing signs of AKI (n = 6) and those showing no signs of AKI (n = 12) regarding impacts per minute, grouped in four impact g-force categories. * The biggest difference between the AKI and no-AKI group is that the no-AKI group managed to run “smoother,” keeping impacts in the lower impact load ranges, while avoiding higher impacts loads.

