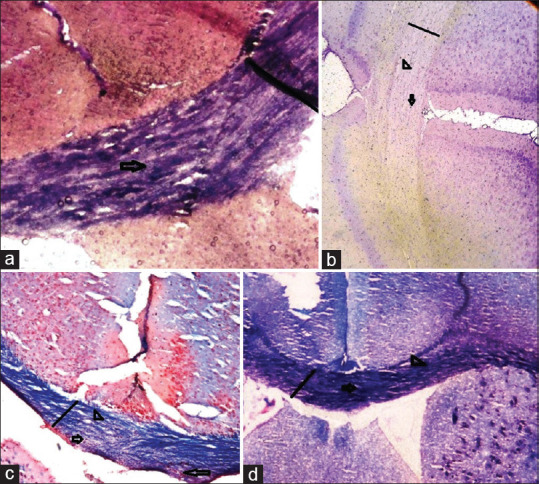
Figure 2.

Luxol fast blue staining on tissue sections from different groups. (a) normal control group, showed normal blue staining of LFB. (b) MS group, blue color of LFB was significantly reduced, which indicated a high amount of demyelination in this group. (c and d) treatment groups, demyelination is considerably lower than the MS group. Myelin density is shown by a straight line, myelin loss is shown by arrowhead, and oligodendrocytes are shown by an arrow. (Magnification 200×)
