Figure 3.

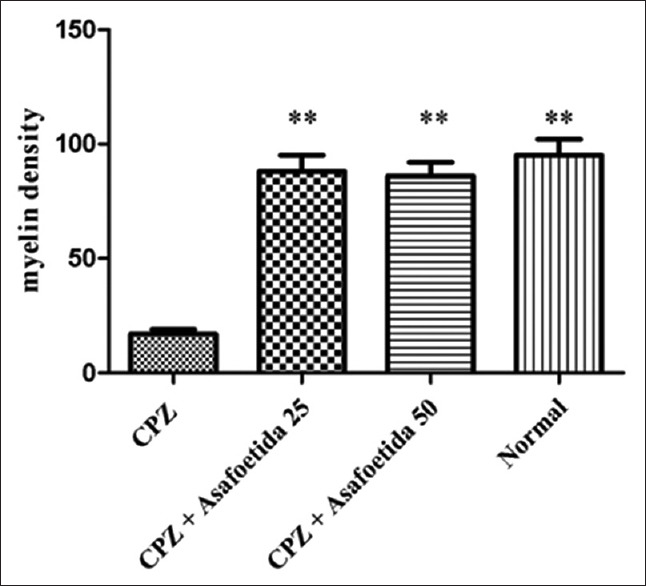
The myelin density in different groups. There was a significant decrease in the myelin density in MS group versus normal control and treatment groups. **Statistically significant at P<0.01

The myelin density in different groups. There was a significant decrease in the myelin density in MS group versus normal control and treatment groups. **Statistically significant at P<0.01