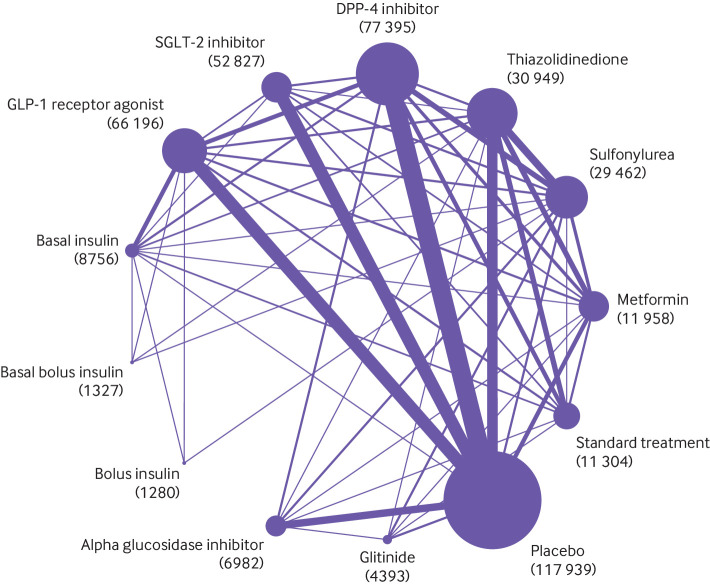
Fig 2.
Network plot of trials evaluating glucose lowering treatments for type 2 diabetes. Network shows the number of participants assigned to each glucose lowering class with the size of each circle proportional to the number of randomly assigned participants in the treatment comparisons (sample size for the specific treatment shown in brackets). Line widths are proportional to the number of trials comparing the corresponding pair of treatments. The most frequent drug comparison was DPP-4 inhibitors compared with placebo. DPP-4= dipeptidyl peptidase-4 inhibitors; GLP-1=glucagon-like peptide-1; SGLP-1=sodium-glucose cotransporter-2

