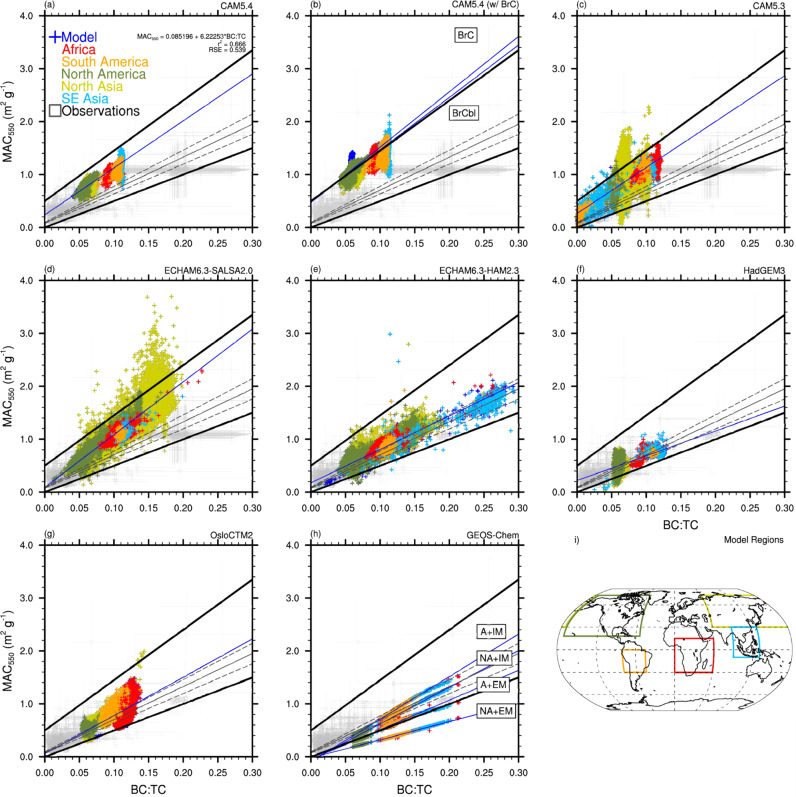
Fig. 3. Comparison of observed and modeled biomass burning mass absorption cross-section versus black carbon to total carbon ratio.
Biomass burning (BB) mass absorption cross-section (MAC) depends on the 550 nm absorption coefficient (βa), as well as BB black carbon and organic aerosol concentrations ([BC], [OA]) (MAC = βa /([BC] + [OA]; m2 g-1). All panels plot BB MAC versus black carbon to total carbon ratio (BC:TC). Observations are in gray. The model data is from a this study, b Brown et al.17, c–g AeroCom Phase-III simulations, and h Saleh et al.16. They are a CAM5.4, b CAM5.4 (w/ brown carbon (BrC)), c CAM5.3, d ECHAM6.3-SALSA2, e ECHAM6.3-HAM2.3, f HadGEM3, g OsloCTM2, and h GEOS-Chem. Model data is representative of BB influenced regions which are color-coded in the model output and are specified on the global plot in i, defined as Africa (red), South America (orange), North America (green), Northern Asia (yellow), and Southeastern Asia (light blue). The two CAM5.4 simulations with BrC b represent brown carbon with and without photochemical bleaching (BrC and BrCbl, respectively). The four GEOS-Chem simulations h represent the four model simulations from Saleh et al.16: no BrC and externally mixed aerosols (NA + EM); BrC and externally mixed aerosols (A + EM); no BrC and internally mixed aerosols (NA + IM); and BrC and internally mixed aerosols (A + IM). The solid gray line is the best fit to observations, with dashed lines representing the 95% confidence intervals of the fit. Thick black lines constrain a reasonable range in BB MAC18. The best-fit to the model data is represented by the solid blue line.

