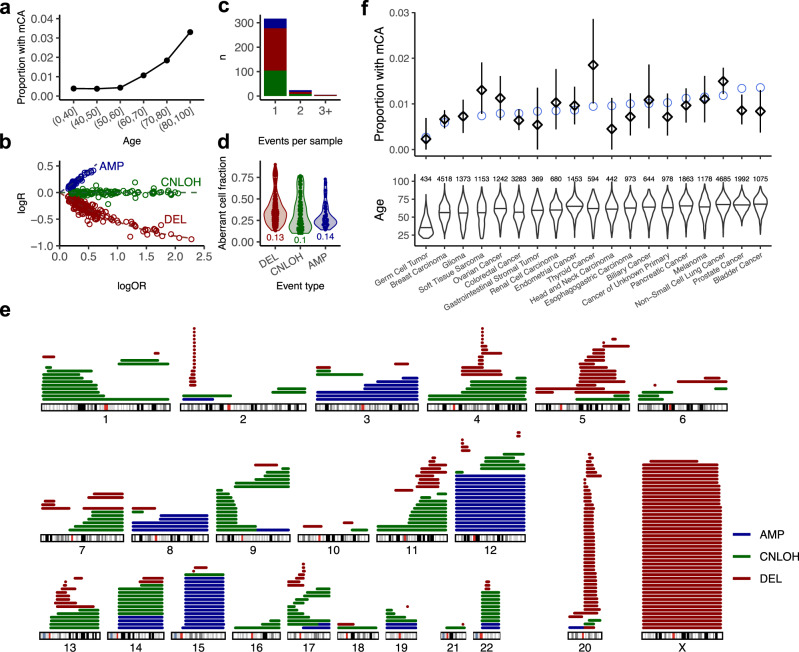
Fig. 1. Landscape of mCA in the MSK-IMPACT cohort.
a Proportion of subjects with detected mCA increases with age. b Classification of events by copy number states. logR: log2 ratio of the coverage depth between analyzed sample and normal comparison. logOR: log allelic ratio between major and minor alleles in heterozygous SNP loci. Events are colored by inferred alteration type. c Number of subjects with 1, 2, or 3+ mCAs. d Cell fraction of detected aberrant clones stratified by alteration type. Numbers below the violins indicate the minimum. e Genome-wide distributions of detected mCAs. f Proportion of subjects with mCA among major cancer types. Squares: observed incidence. Blue circles: expected incidence. 95% CI are shown in black. Number of patients are displayed in the middle. Source data are provided as a Source Data file.

