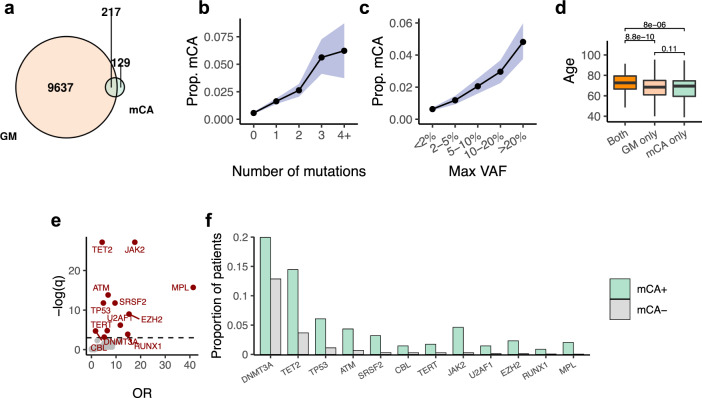
Fig. 2. Global characteristics of mCA in relation to gene mutations.
a Overlap between CH cases carrying gene mutations (GMs) and chromosomal alterations (mCAs). Number of subjects are shown in black. b, c The prevalence of mCA increases with mutation burden and VAF. Observed proportion of mCAs within each subgroup is shown as solid dots; 95% CIs generated from a binomial distribution around the observed proportion are shown in blue shades. Gene mutations in regions affected by mCAs are excluded from this analysis. d Age distribution of subjects with mCA only, gene mutations only, and both types of mutations. Unadjusted P values derived from a two-ended Student’s t-test are shown. The lower and upper bounds of boxes denote 25th (Q1) and 75th (Q3) percentiles of observed ages, respectively. The lower and upper whiskers indicate the minima (Q1 − 1.5*IQR) and maxima (Q3 + 1.5*IQR). e Volcano plot of q values and odds ratios of gene representation in mCA-positive versus mCA-negative cases (Fisher’s exact test). Genes significantly enriched (FDR < 0.05) in mCA subjects are colored in red. f Frequency of gene mutations significantly enriched in subjects with mCA. Source data are provided as a Source Data file.

