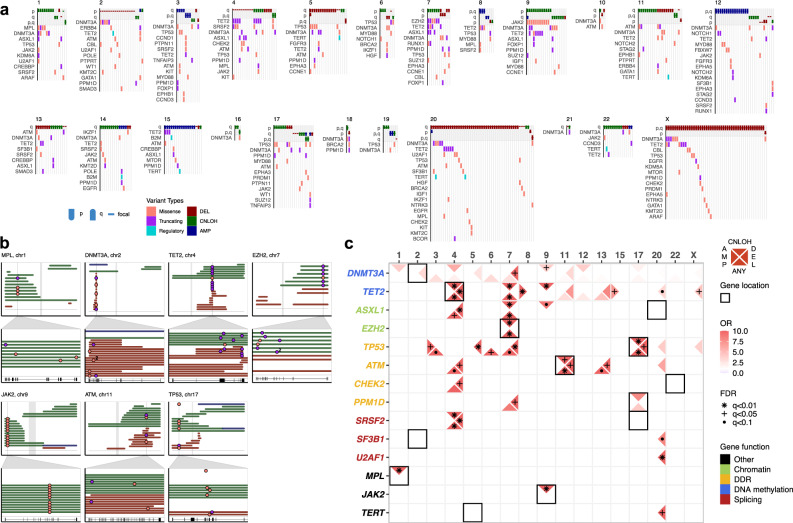
Fig. 3. Patterns of co-occurrence between mCAs and gene mutations reveal diverse mechanisms of selection.
a mCA events and their co-occurring gene mutations. Events are colored by alteration types. Only genes that appear more than one time are shown. b Gene loci that exhibited recurrent double hits in cis. Zoom window shows the gene loci affected and the location of the gene mutations; “2” denotes two adjacent mutations in close proximity with each other. Centromere positions are marked in gray. Gene structures are displayed below. c Pairwise associations of co-mutations between specific mCAs and gene mutations. Associations with specific chromosomal alteration types are indicated by the position of the triangle (left: AMP, top: CNLOH, right: DEL, bottom: any). FDR-corrected significance values from pairwise Fisher’s exact tests are indicated by shapes of asterisks. Odds ratios are indicated by the transparency of red shading. The chromosomal location of genes are indicated by black squares. Gene labels are colored by functional groups. Source data are provided as a Source Data file.

