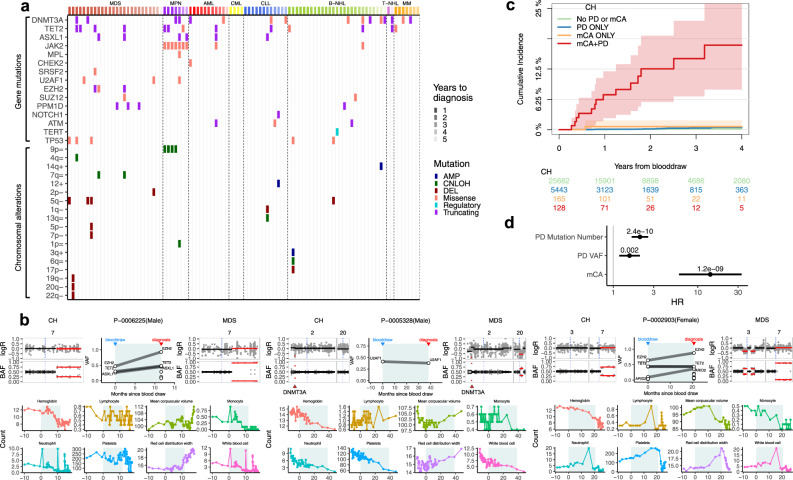
Fig. 4. mCA and evolution to hematologic malignancies.
a CH mutations detected at initial blood draw in patients who had a subsequent hematological cancer diagnosis. Patients in each disease category (top bar) were arranged by increasing time to diagnosis. Events are colored by mutation types (=, CNLOH; −, deletion; +, amplification). b Exemplar cases of genomic evolution from CH with detectable mCA to myeloid neoplasms. Gene mutations at the time points of blood draw and diagnosis are shown in the middle, while regions of chromosomal alterations are shown on the left and right, respectively. Solid lines indicate signal median. Aberrant regions are colored in red. BAF, B-allele frequency. Serial blood count indices are shown below, where the shaded areas in blue indicate the period between initial blood collection and MN diagnosis. c Cumulative incidence of leukemia among patients who had detectable mCA only, gene mutation putative driver (PD) only, both, or neither; 95% CIs are shown in shaded ribbons. d Association of CH features with subsequent leukemia diagnosis. Hazard ratios (HR; solid dots), 95% CIs (horizontal bars), and unadjusted P values (above horizontal bars) are derived from a multivariable cause-specific Cox regression model with a 9 month landmark. The HR for 10% increment in gene mutation PD VAF was shown. mCA status was included as a binary indicator. Source data are provided as a Source Data file.

