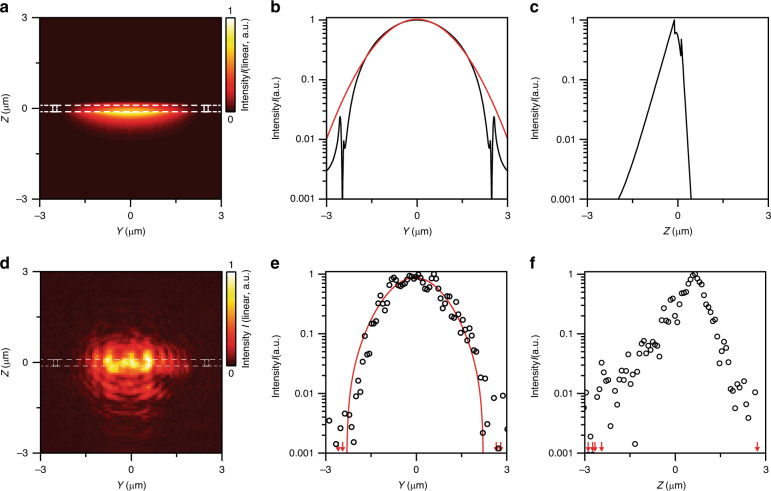
Fig. 3. Waveguide mode cross-section.
a 3D FDTD simulation obtained under multimode excitation of the waveguide. b Mode cross-section of (a) at Z = 0, where the black line is the simulated data and the red line is a Gaussian fit (FWHM = 2.9 µm). c Mode cross-section of (a) at Y = 0, where the black line is the simulated data. d Experimental far-field image of guided light emitted from a cleaved waveguide facet. e Cross-section of (d) at Z = 0, where the black circles are the measured data and the red line is a Gaussian fit (FWHM = 1.9 µm). f Cross-section of (d) at Y = 0, where the black circles are the measured data. Red arrows in (e, f) indicate data points outside the plot window. White dashed lines in (a, d) show the outline of the waveguide structure as defined in Fig. 1b

