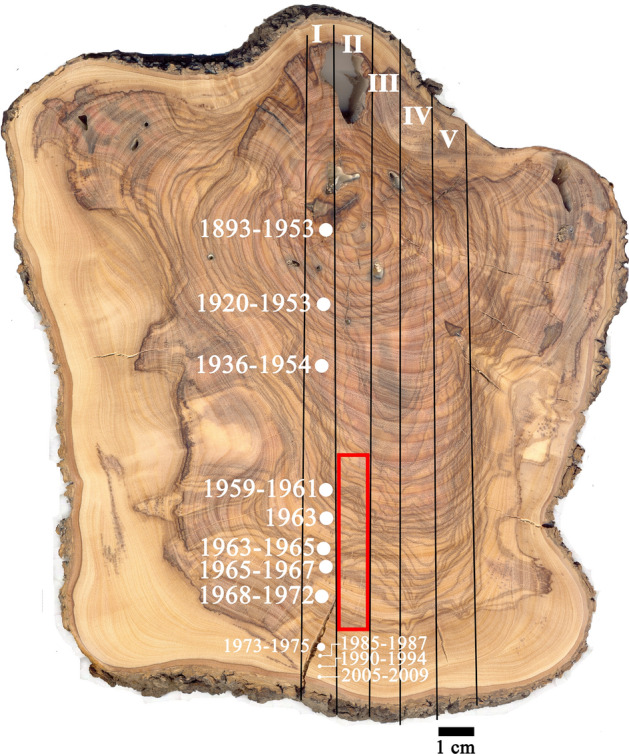
Figure 1.

Olive branch cross-section. Five segments were cut along the section (I-V). Segment I was sampled at numerous points to obtain chronological data by radiocarbon dating. From segment II, 5 mm into the surface shown in the image, a 6 × 1x0.5 cm section (in red frame) was cut between the points dated 1959–1961 and 1968–1972, in order to contain the maximum point of the “bomb peak” period of increased atmospheric radiocarbon. This section from segment II was cut into a series of 96 independent samples that underwent radiocarbon dating and δ13C measurement. The tangentially parallel section was cut from above this segment, at the surface level shown in the image, for CT scanning following charring. The parallel section in segment III was CT scanned as fresh material. Segment IV was sampled for SEM–EDS analysis. A higher-quality image of the section is available in the supplementary material.
