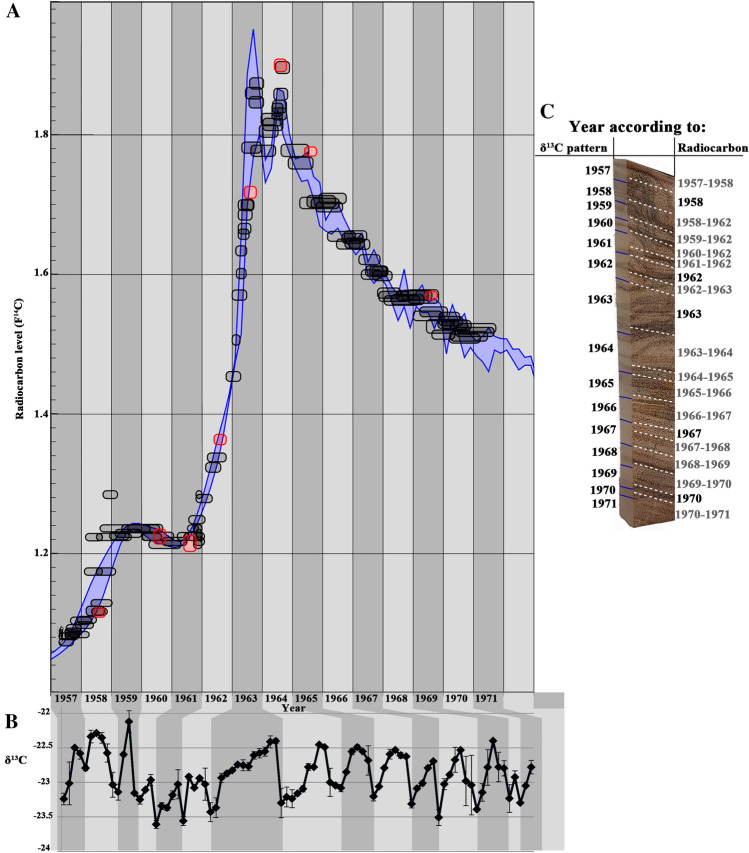
Figure 2.
Radiocarbon and stable carbon isotopes data from olive wood. (A) A consecutive series of thin sections was sampled through an olive wood radius (96 samples in total) ranging from 1957–1971, a time period in which the “bomb peak” of increased atmospheric 14C can be used as reference (wide purple line). Olive wood samples from which α-cellulose was extracted and radiocarbon dated are indicated in black. As a control, a number of α-cellulose samples extracted from the latewood of pine growing in the same field as the olive tree were also analyzed for 14C and are marked in red. Results have been compared to the 14C calibration curve using OxCal v 4.231 with the Bomb 13 NH2 calibration curve. (B) δ13C values for α-cellulose of all olive wood samples dated. The demarcation between years (light gray to dark gray) was evaluated according to minimum δ13C values and is aligned to the 14C data. (C) Radiocarbon calibrated years (modeled by OxCal 4.2) between dashed white lines and years according to δ13C variation pattern between blue markers.

