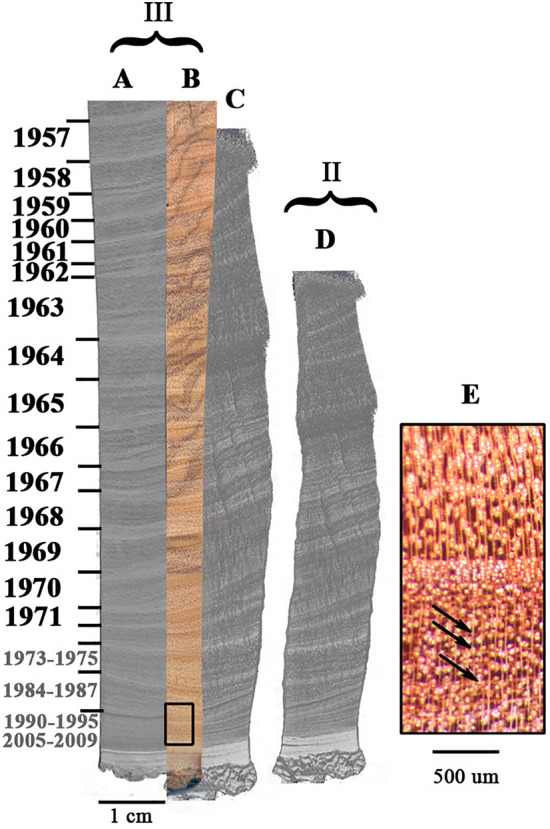
Figure 4.

Micro-CT scan of olive wood. The micro-CT image of fresh wood (A) is shown in comparison to the actual image (B), both from segment III. (D) Charred sample from segment II after 30 min at 500 °C in continuous nitrogen flow. As charring caused warping and a decrease in size, (C) is the result of digitally stretching the original image (D), to more easily correlate the ring sequence to (A) and (B). Note that each marked ring is defined by a clear change in density, appearing as a strip of a lighter shade. Combining the radiocarbon data and δ13C patterns across the section, with the putative ring boundaries as seen in the micro-CT scan, each such defined ring was assigned a specific year. Year ranges in gray represent the calibration results from radiocarbon dating the cellulose extracted from sawdust encompassing the entire corresponding wood area for each result. (E) The magnified area outlined in (B), indicating examples of parenchyma bands, which can be interpreted as annual (see text). Ring widths between charred and fresh wood are compared in Figure S5 and Table S3.
