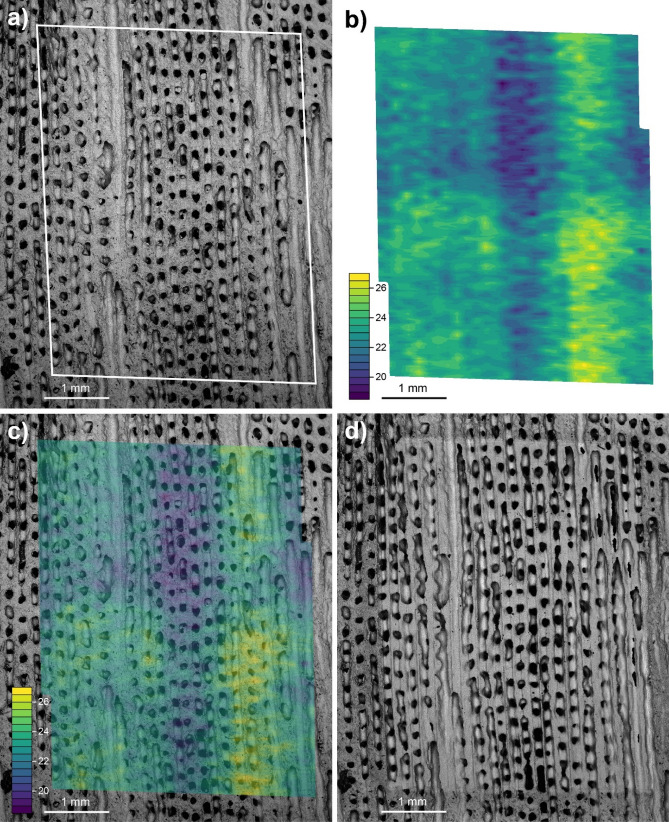
Figure 3.
(a) Pre-ablation SEM image of the coral sector analysed by LA; (b) δ11B map of coral area, where yellow colours show high δ11B values (> 25‰), green colours show intermediary δ11B values (c.21–25‰) and blue colours show low δ11B values (< 21‰); (c) Overlay of δ11B map and SEM image, the values clearly match the structural elements of the coral with high values being confined to the polyp walls and low values to the columella. Sub-annual variability of ~ 1‰ is visible in the wall edges which may correspond to the dissepiments (not-visible). The two walls analysed show very similar trends but at different absolute values implying a potential 3-dimensional component to the analyses. (d) Post-ablation SEM image of the coral area ablated.

