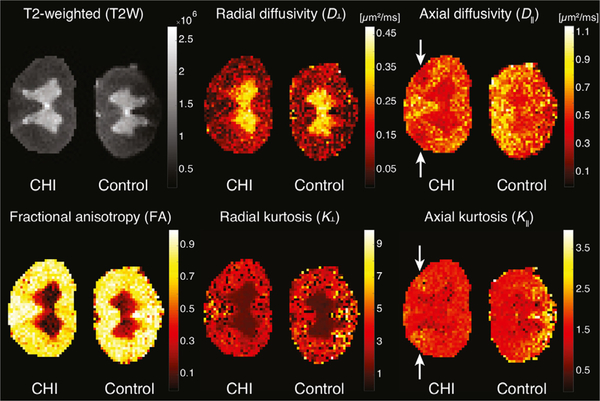
Fig. 4.
Voxel-averaged metrics. From left to right, top to bottom, T2W, D⊥, D∥, FA, K⊥, and K∥ images. Note the insensitivity of the T2W, D⊥, and K⊥ images to the axonal injury in the CST region of the left hand side spinal cord. Slight hypointensity in the D∥ and hyperintensity in the K∥ images are evident at the injury site (white arrows), although it is non-specific to the axonal injury and is seen in uninjured regions as well.

