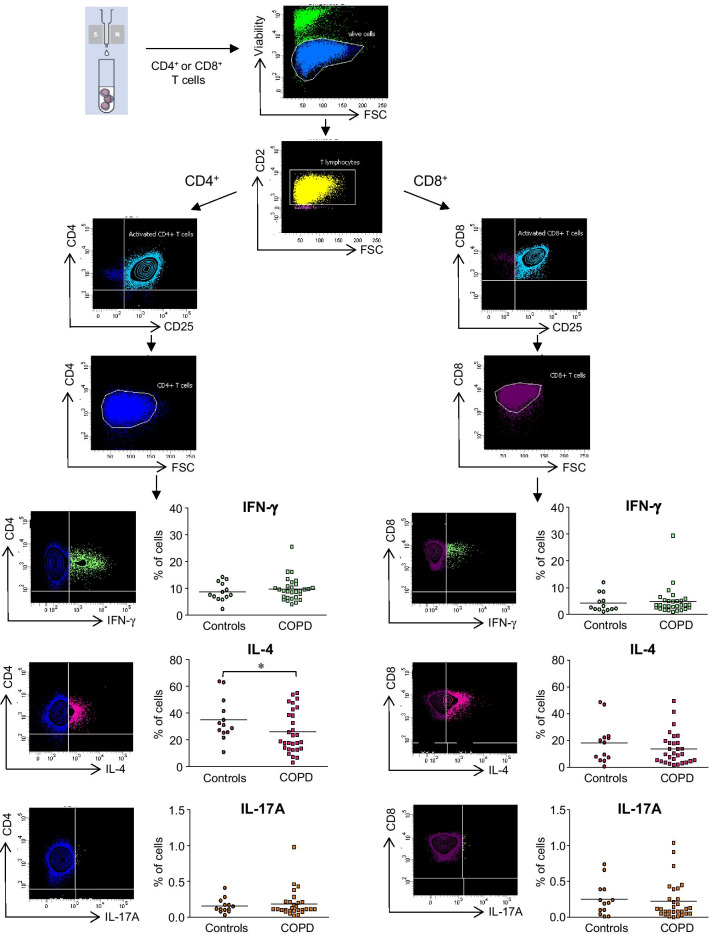
Fig. 1.
Intracellular cytokine expression by T lymphocytes isolated from COPD patients and controls. Flow cytometry analysis of intracellular cytokine expression (IFN-γ, IL-4 and IL-17A) was performed after anti-CD3/CD28 stimulation of CD4+ T-cells or CD8+ T-cells sorted from PBMC isolated from COPD patients (n = 29) and controls (n = 13). The plots show sequentially the gating hierarchy of one representative sample: live cells, CD2+ T-cells and subsequently activated CD25+ CD8+ T-cells or activated CD25+ CD4+ T-cells. The plots on the lowest rows include the cytokine expression gates for either CD8+ T-cells or CD4+ T-cells. Fluorescence minus one control condition, in which the antibody conjugate in question is omitted, is used to guide creation of the gate that defines positive expression of that target. A total of 20,000 CD4+ T-cell events or 20,000 CD8+ T-cell events were acquired per sample. Values are expressed as percentage of activated CD4+ CD25+ or CD8+ CD25+ T cells expressing each cytokine. *p < 0.05

