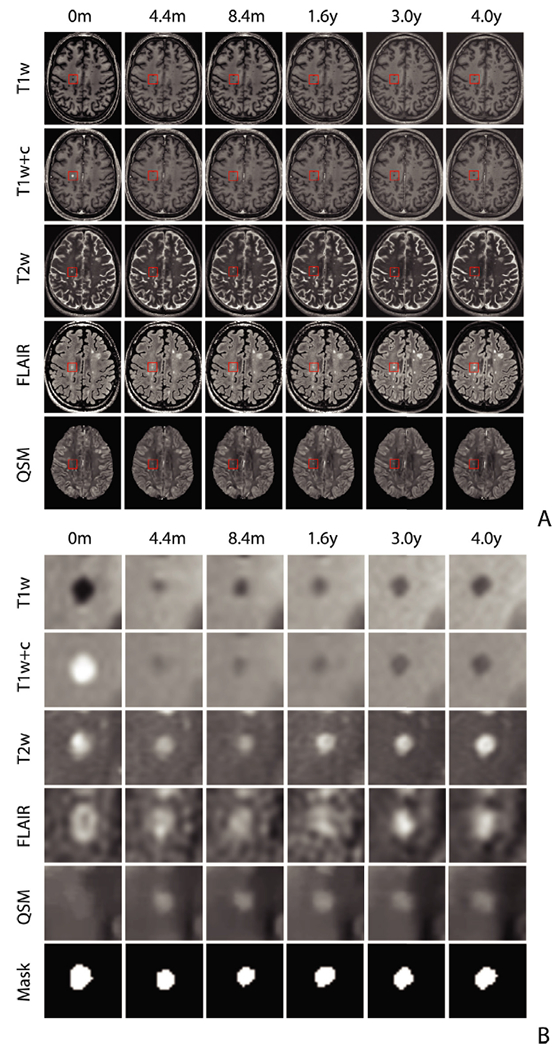
Fig. 2. The MRI sequences at each time point for the whole brain (A) and lesions (B).

Example of the longitudinal brain scans and lesion evolution on conventional T1w, T2w, FLAIR, as well as T1w+c and QSM images over a 4-year period. Lesion age is estimated from the image intensity within the lesion masks drawn on the T2w image at each time point as shown in the bottom row of (B).
