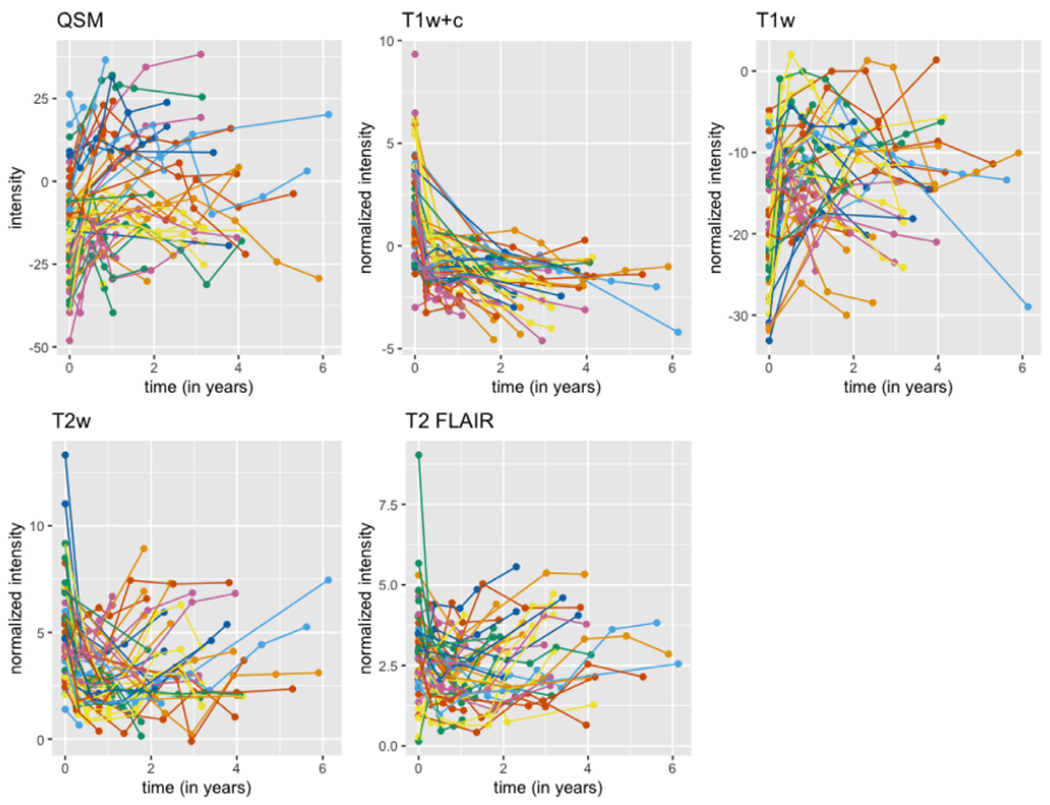
Fig. 3. Mean radiomic feature for the 15 mm3 cutoff.

The plot shows the mean radiomic feature, the mean intensity over time entire lesion, for each of the 5 sequences at all time points. Time points for the same lesion are connected with lines. The colors in the plot denote different patients, but colors are repeated.
