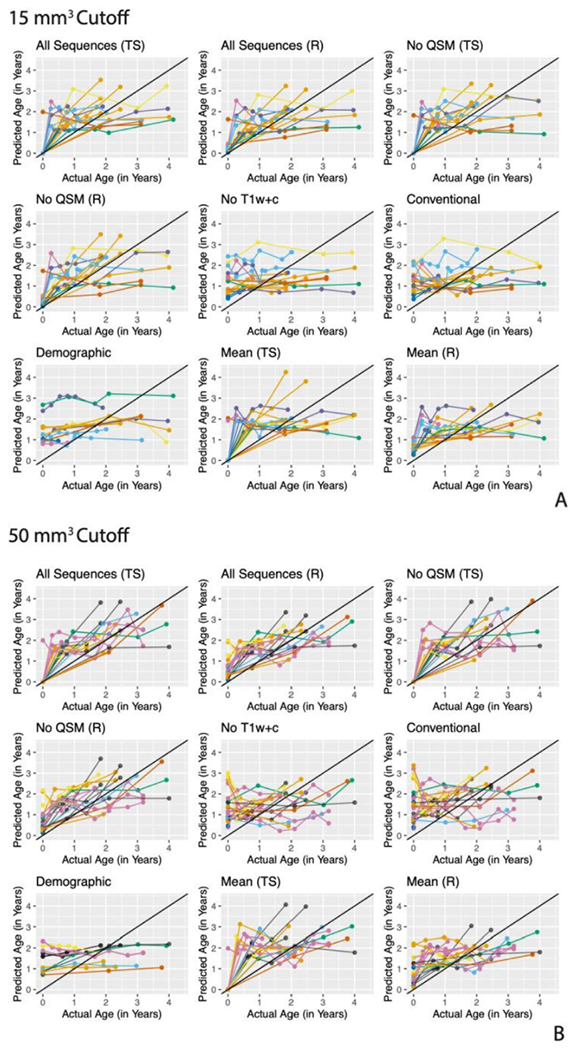
Fig. 4. Prediction in validation set for the 15 mm3 (A) and 50 mm3 (B) cutoff.

The predicted lesion age versus the actual lesion age for observations in the validation set for the nine modeling scenarios for each of the two cutoffs. Observations are colored by subject and observations from the same lesion are connected by lines.
