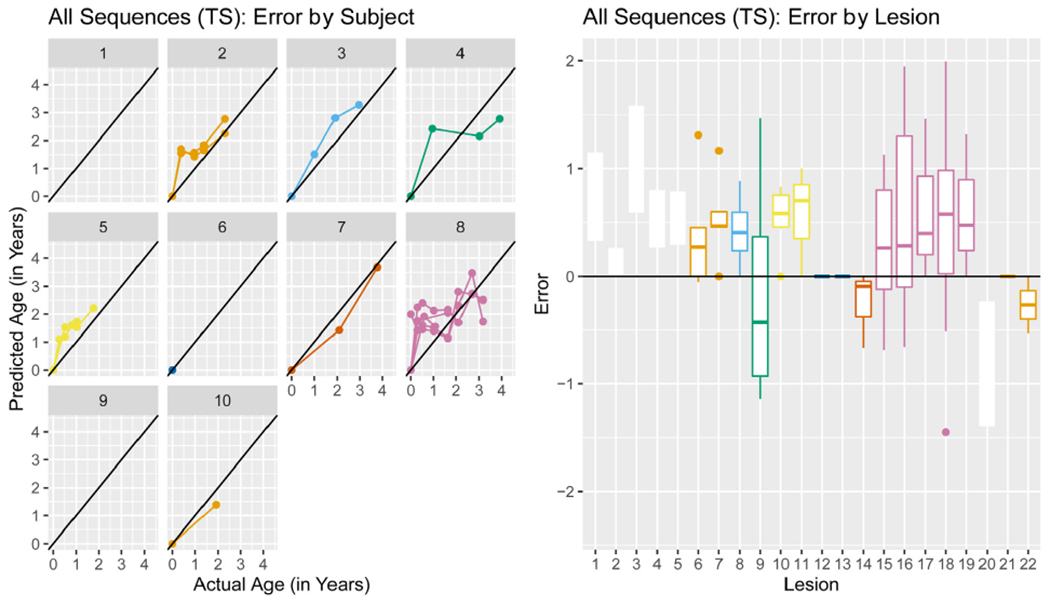
Fig. 9. All Sequences (TS) errors by subject and lesion for 50 mm 3 cutoff.

The predicted age versus the actual age (left) stratified by subject. The error by lesion (right) colored by subject, using colors that correspond to the plot on the left.

The predicted age versus the actual age (left) stratified by subject. The error by lesion (right) colored by subject, using colors that correspond to the plot on the left.