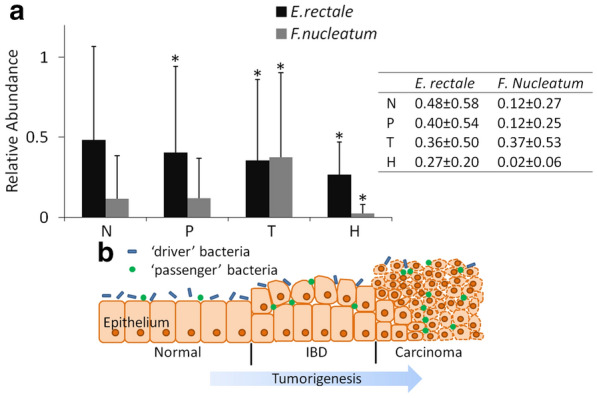
Fig. 3.

Abundance of bacteria in patient samples and diagrammatic sketch of colon epithelium. a Abundance of E. rectale and F. nucleatum at different sites on the colon in samples of 75 patients and 26 health people is shown as mean ± STD. “N” represents normal epithelia position of patients, “P” represents para-tumor epithelia position of patients, “T” represents tumor surface of patients, “H” represents healthy people. Other groups were compared with group “N” separately using Student’s t test. *P < 0.05 represents a significant difference from the value in the “N” group. b During tumorigenesis, abundance of ‘driver’ bacteria, which contributed to tumor initiation, decreased gradually owing to the high competition from the ‘passenger’ bacteria in IBD or tumor niche
