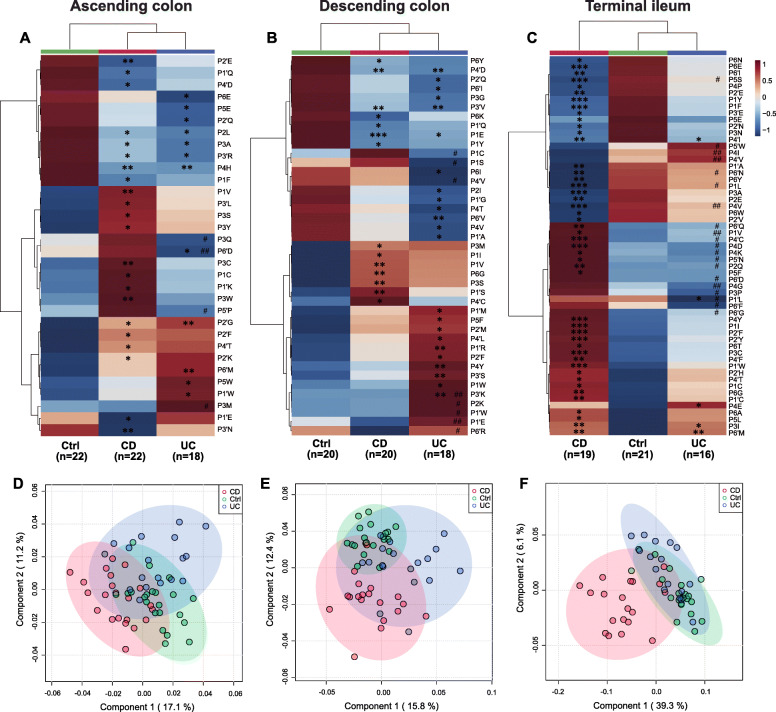
Fig. 7.
Location-specific alterations of gut microbial proteolytic motif in the MLI metaproteome of IBD. a and d ascending colon, b and e descending colon, and c and f terminal ileum. Hierarchical clustering analysis (a–c) and partial least squares discriminant analysis (PLS-DA, d–f) of altered amino acid frequencies around the cleavage site in IBD. Group averages are shown in the heatmap. Dunn-Bonferroni post hoc analysis following Kruskal-Wallis test was employed to detect significant difference among three groups (CD, Ctrl, and UC). *P < 0.05 versus Ctrl; **P < 0.01 versus Ctrl; ***P < 0.001 versus Ctrl; #P < 0.05 (CD versus UC); ##P < 0.01 (CD versus UC); ###P < 0.001 (CD versus UC)

