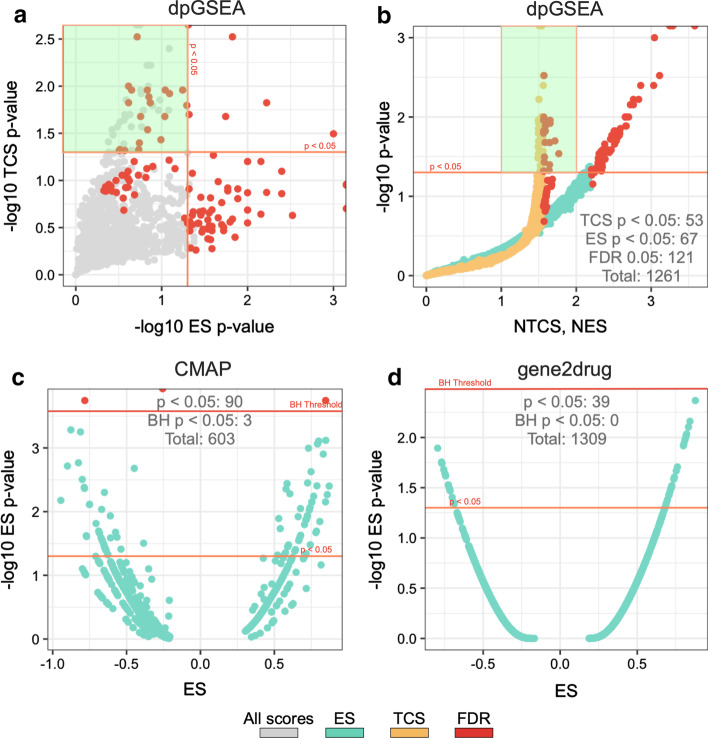
Fig. 4.
Comparisons between the trends of scores and significance for dpGSEA and the CMAP native and gene2drug approach. Each point within each plot represents a screened drug’s significance and score within an equivalent run for dpGSEA (plots a, b), CMAP native (plot c), and gene2drug (plot d). Screened drugs that pass a designated FDR significance threshold (0.05) are shown in red, and screened drugs highlighted in green show statistically significant findings unique to dpGSEA’s novel TCS. Total number of screened drugs within specific significance thresholds are also shown, and it should be noted that the number passing FDR α = 0.05 using the GSEA-defined FDR threshold (plot a, b) is 121 while those that pass the BH defined threshold are 3 and 0 for CMAP and gene2drug, respectively (plot c, d)

