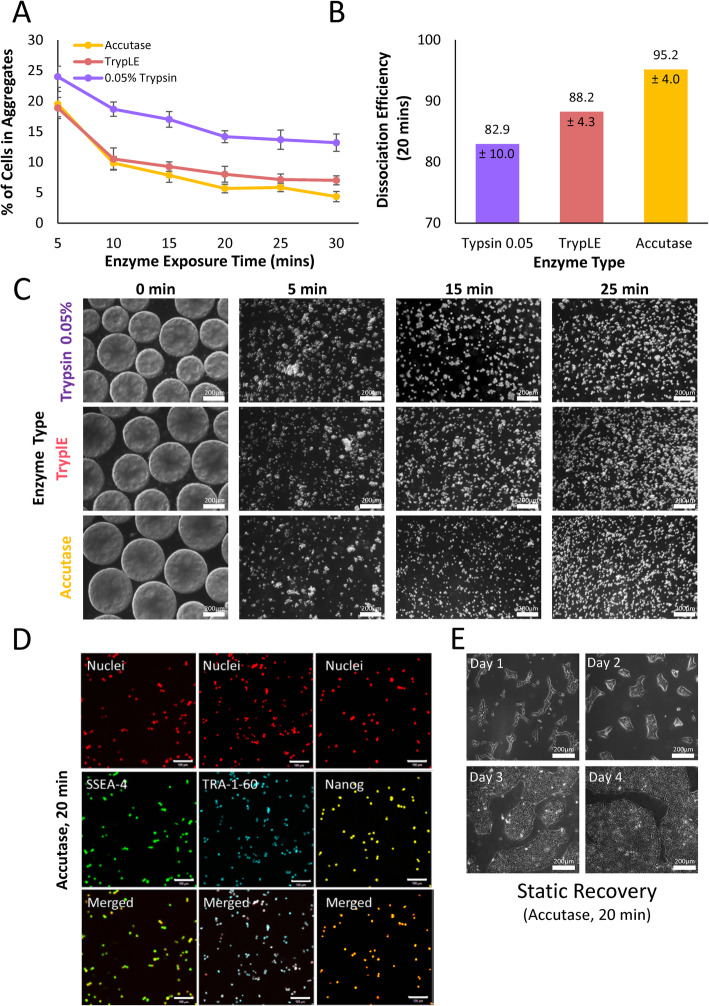
Fig. 5.
a Percent of cells in aggregates, b dissociation efficiency, and c representative brightfield microscopic images of hiPSC aggregates exposed to either Accutase, TrypLE, or 0.05% Trypsin for periods of 5–30 min during full bioreactor harvesting (scale bar = 200 μm). d Representative confocal microscope images of hiPSC single-cell samples taken from the full bioreactor harvest (Accutase for 20 min) and stained for pluripotency markers SSEA-4, TRA-1-60, and Nanog (scale bar = 100 μm). e Representative brightfield microscope images of hiPSCs taken from the full bioreactor harvest (Accutase for 20 min) and seeded onto Matrigel-coated dishes for static recovery (scale bar = 200 μm). Cell samples were collected from n = 4 stirred suspension bioreactors at each condition. The P values were set at 0.05 and all graphs are presented with a ± standard error of the mean (SEM)

