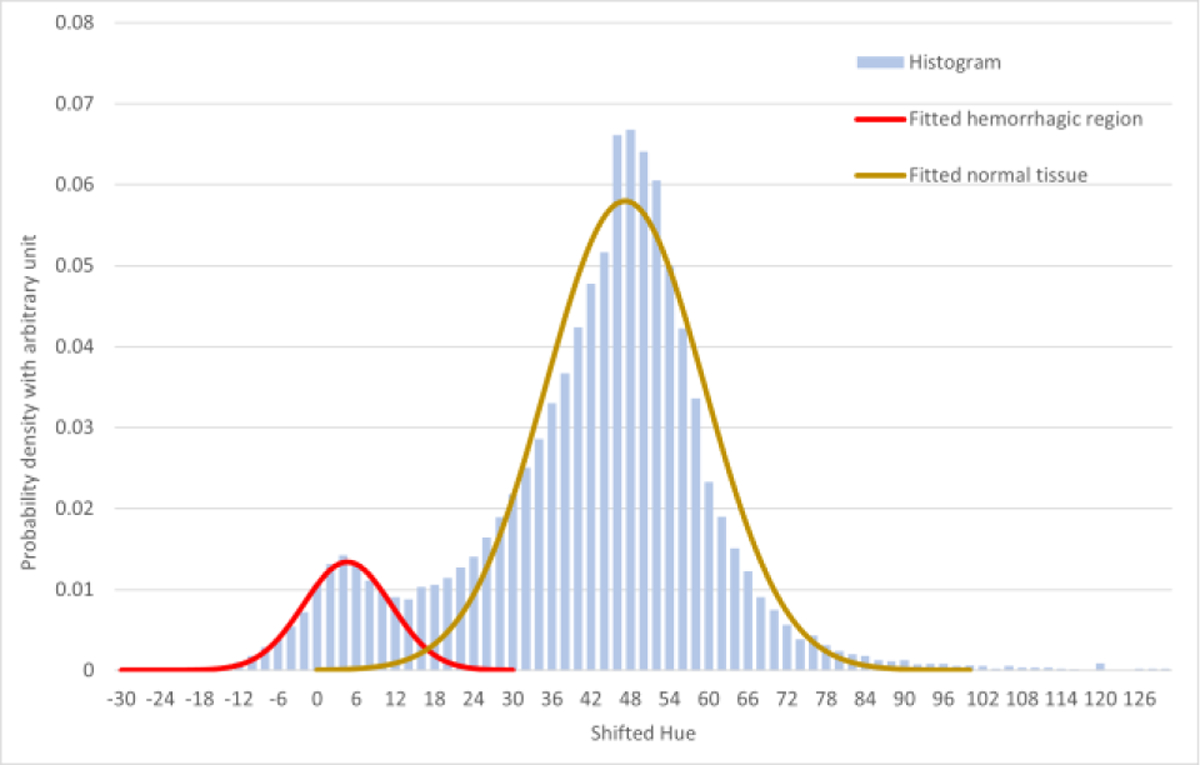
Fig. 3.

The Hue histogram consists of two overlapped peaks, one peak representing pixels belonging to the normal tissue, and the other peak representing pixels belonging to the hematoma tissue. It is reasonable to assume that distribution of normal brain tissue and the distribution of hematoma tissue are independent. These two peaks can be fitted into two Gaussian distributions (with R2 = 0.9949 for hematoma peak, and R2 = 0.9713 for normal brain tissue peak), and the overall histogram can be seen as a linear combination of these two Gaussian distributions. Though the “valley” between two distributions is not deep to zero, i.e., completely separate, we can seek available theory to solve the problem.
