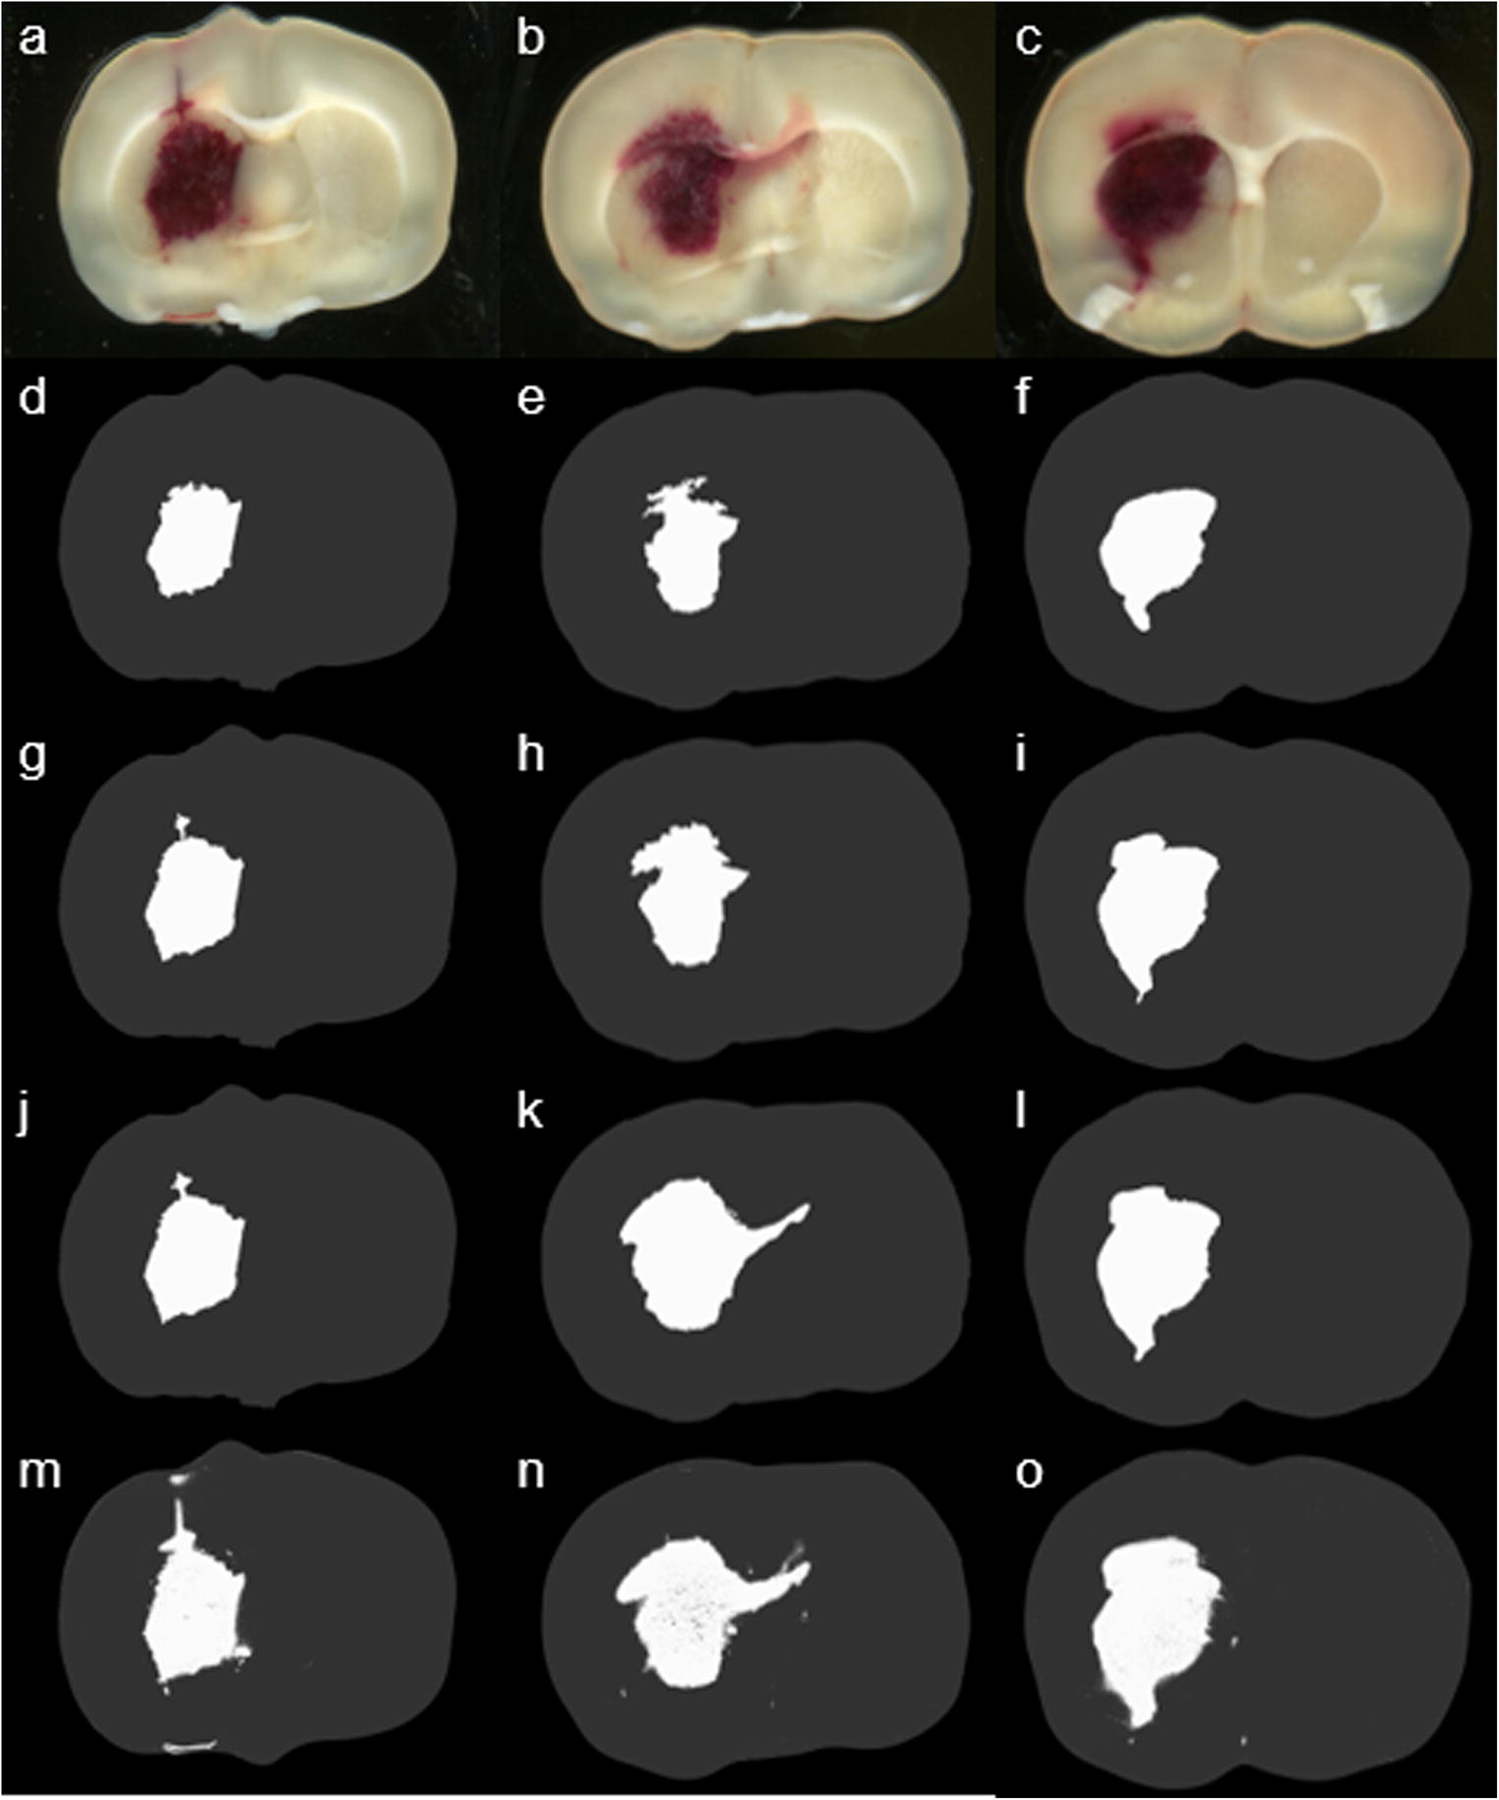
Fig. 4.

The top row (a-c) shows the original sections at different bregma levels. The second to the forth row (d-l) of the images represent three different manual segmentations by using Adobe® Photoshop®. Due to a different sample of hematoma regions each time, delineation of the hematoma region was determined by a different threshold. The bottom row (m-o) shows the results from the proposed automated color segmentation processing procedure.
