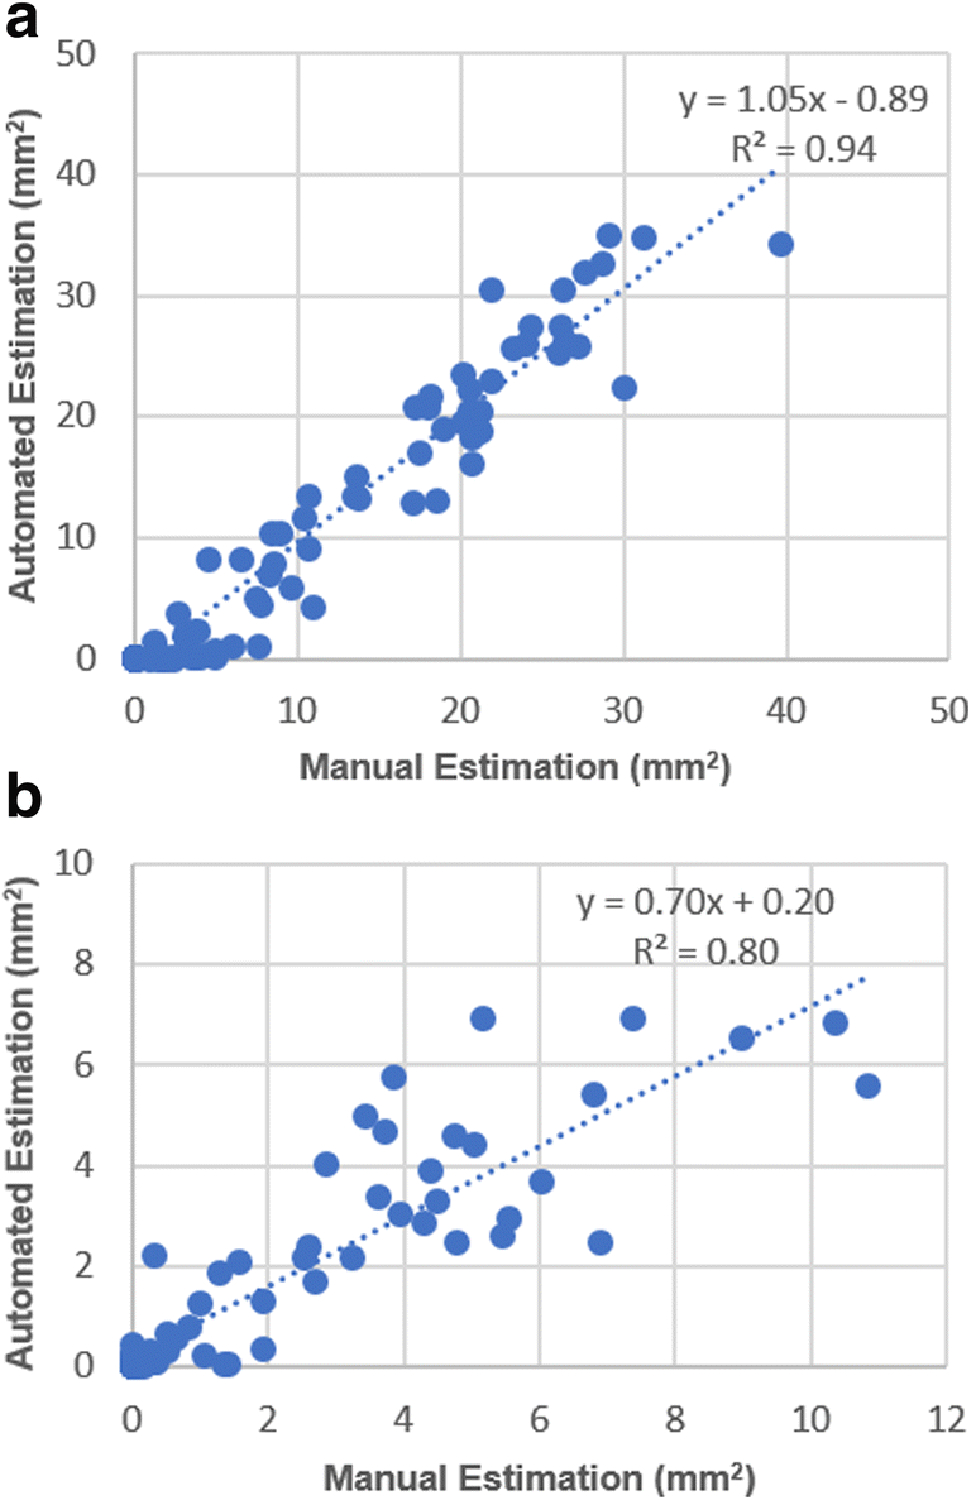
Fig. 6.

(A) Rat model: Correlation between manually acquired hematoma area and automatically acquired hematoma area shows that the proposed method is consistent with the manual processing (slope = 1.05, R2 = 0.94, p < 0.0001). (B) Mouse model: Correlation between manually acquired hematoma area and automatically acquired hematoma area shows that the manual processing slightly overestimated hematoma area (slope = 0.70, R2 = 0.80, p < 0.0001).
