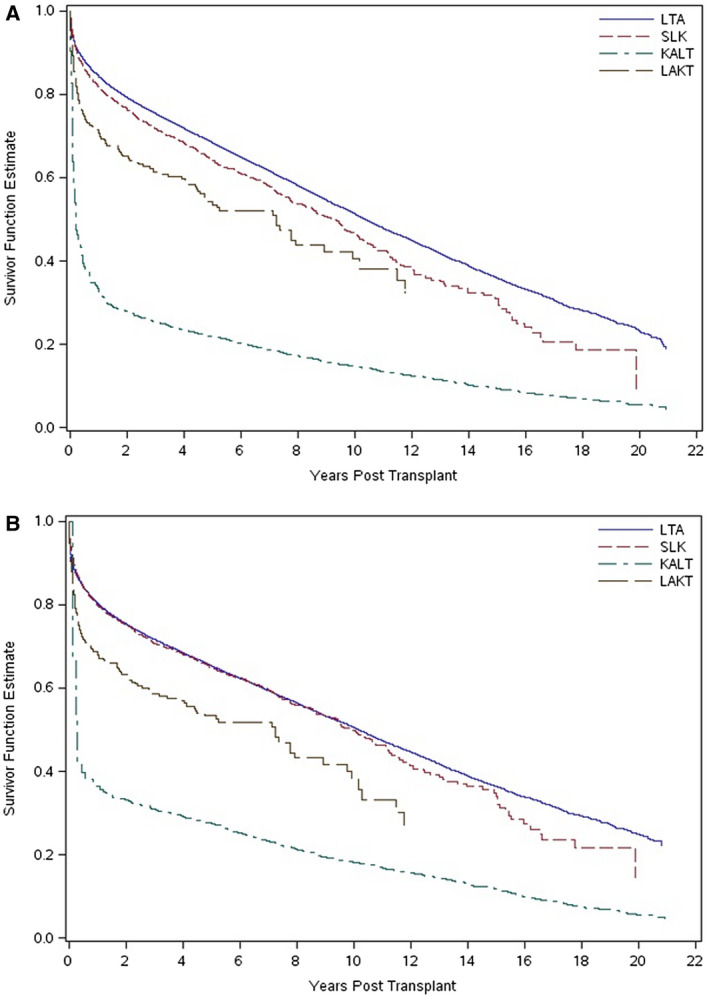
FIG 1.

(A) Unadjusted Kaplan‐Meier curves for overall recipient survival with LTA, SLK, KALT, and LAKT. P < 0.001 for LTA versus SLK, KALT, and LAKT; P < 0.001 for SLK versus KALT; P = 0.003 for SLK versus LAKT; and P = 0.64 for KALT versus LAKT. (B) Unadjusted Kaplan‐Meier curves for overall graft survival with LTA, SLK, KALT, and LAKT. P = 0.27 for LTA versus SLK; P < 0.001 for LTA versus KALT and LAKT; P < 0.001 for SLK versus KALT and LAKT; and P < 0.001 for KALT versus LAKT. Reproduced with permission from Liver Transplantation. 5 Copyright 2012, American Association for the Study of Liver Diseases.
